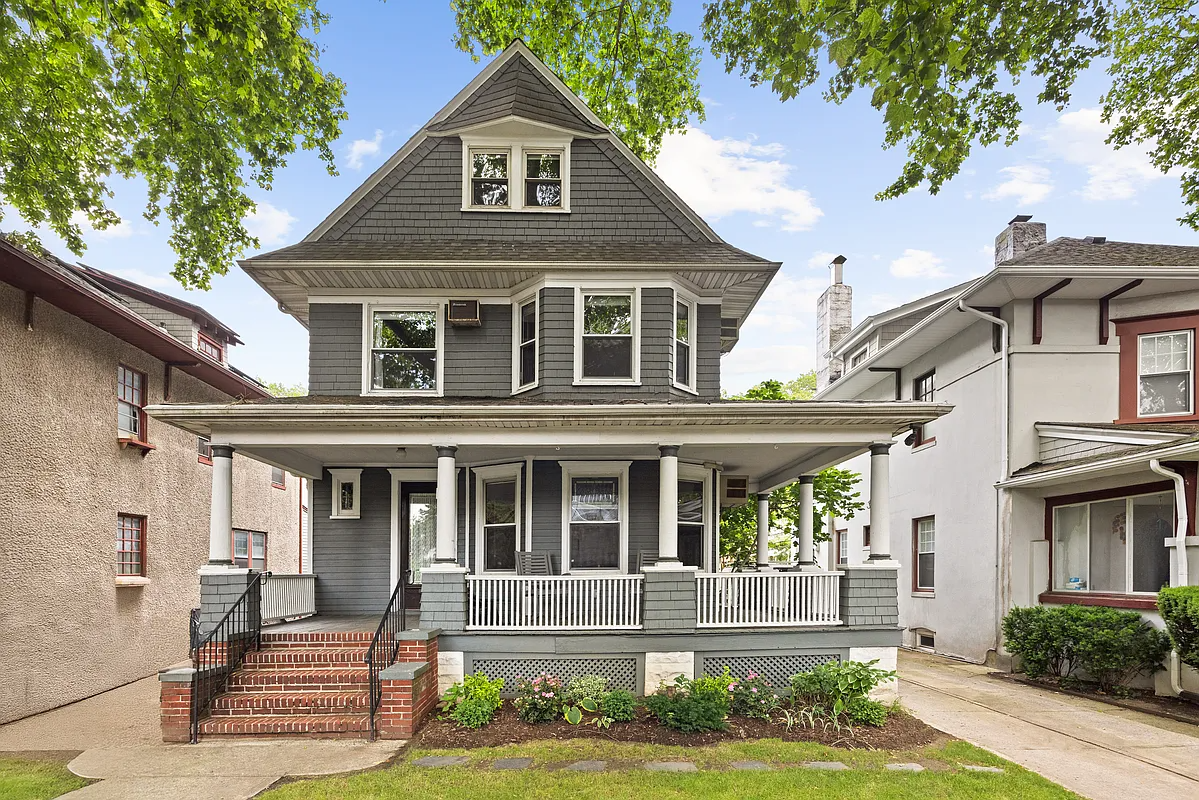
WIDGET UPDATE: Since the pricing widget has now been up and running for exactly six months, we spent a little time yesterday looking at some data to try to see if it has any predictive ability. We came up with a list of twelve properties that had been both subjected to the widget treatment and…

WIDGET UPDATE: Since the pricing widget has now been up and running for exactly six months, we spent a little time yesterday looking at some data to try to see if it has any predictive ability. We came up with a list of twelve properties that had been both subjected to the widget treatment and gone on to sell. The findings were quite interesting: In every single case, the average predicted selling price fell short of the actual selling price. The interesting thing was the consistent range by which the widget underpriced. The widget price was between 9.4% and 19.8% under the ultimate selling price; on average the widget underpriced by about 14%. So we’re going to create a second-generation widget that shows average and median predictions as well as a predicted selling price based on the historical track record. Hopefully that’ll get done in the next couple of weeks. The twelve data points are listed below. P.S. If any reader would like to become the official keeper of the widget spreadsheet and try to keep an eye on this stuff, we’d be more than happy to hand it off!


Wow, Miss Muffett. You seem to have missed the whole point of this post, which is that there is a consistent relationship between widget and sale price. The actual sale price is on average about 12 percent above the widget price.
FWIW, I’ve always found the widget meaningless given it’s just a bunch of anonymous posters plugging in any old number based on who knows what criteria. I mean, do people seriously think today’s HOTD is going to way over ask the way some widget-users predict?
prize idea. you get your own front-page rant about anything, and you can choose any 5 people to block from commenting.
I think one thing that could make the widget more accurate would be if users had some incentive to be right with their estimates. That’s what the point of the widget is: to guess the price it will sell at, not what you think it should sell at. If Brownstoner even had some sort of nominal prize for the closest guess, I bet we would see the accuracy move to within 10%.
“Shill, please tell us more of your nonsense!”
Speaking of stupid people, hi 11217! I meant in Brooklyn, not natioanlly. But thanks for the data. dumb-ass.
benson that’s good data. But the number you quote for 305 3rd #3H isn’t right. 989 was the last offer price. It probably sold for less than that, and I don’t think that would be public record til it closes, right? That’s the most important point in your list. I agree however that prices have stayed stubbornly high, especially when you compare to 2004, when unemployment was half what it is now, and credit was easy.
Question for you — are all of the issues in those buildings taken care of now?
benson- the answer is, “there’s a sucker born every day.” now get back to work.
12 months = YOY.
If nothing further changes (miss muffie doesn’t drop a shoe), then 1Q10 per bho “science”, reading will be flat YOY.
12 consecutive flat months gets you to flat YOY, if i’m following your “math” could be sooner with upticks or longer with downticks. this is not rocket science.
otoh, i will note that your preferred metric indicates 1) peak nyc was jun 06 and 2) we are already at jun 04 prices and i can assure you that this is not the case.
i am quite comfortable arguing the peak occurred 18-24 months later in ny and that we are not near jun 04 prices, maybe we’ve taken two years of price appreciation out. call it mid 2006 in brooklyn
Muffie, one more thing. When I last reported the data from my condo, after the January 2009 sale, you told me that the “Lehman effect” had not yet taken place, and that you had seen that prices for condos were cratering in the middle of 2009? Do you remember that?
Well, what happened? Where is the cratering?