
Where and When Will The Market Bottom?
Most people interviewed in this weekend Times article about New York’s real estate market finding its bottom seem to agree that prices so far have come down about 25 percent; how much further they have to fall is a matter of more varied opinion, though it sounds like 10 or 15 percent would be a…

Most people interviewed in this weekend Times article about New York’s real estate market finding its bottom seem to agree that prices so far have come down about 25 percent; how much further they have to fall is a matter of more varied opinion, though it sounds like 10 or 15 percent would be a consensus range. Which means we could be closer to the bottom than past cycles would suggest. Even if the New York market were to end up being 35 to 45 percent down, he said, to the degree we’re seeing deals done at 30 to 32 percent down anyway, it’s not very far away. What may happen, some speculate, is that the correction, however brutal, could be accelerated into a shorter time period that last go-round. It’s possible that rather than seeing price declines spread out over a six-year period, this time it could be concentrated in a two-year period, said Ingrid Gould Ellen, co-director of the Furman Center for Real Estate and Urban Policy at NYU’s School of Law. That possibility, along with the fact that there are plenty of folks waiting in the wings wanting to buy, has the brokerage community cautiously optimistic that the real estate business may avoid having a lost decade. After all, what broker’s need to get paid are transactions more than high prices.
Looking for Bottom in N.Y. Real Estate [NY Times]
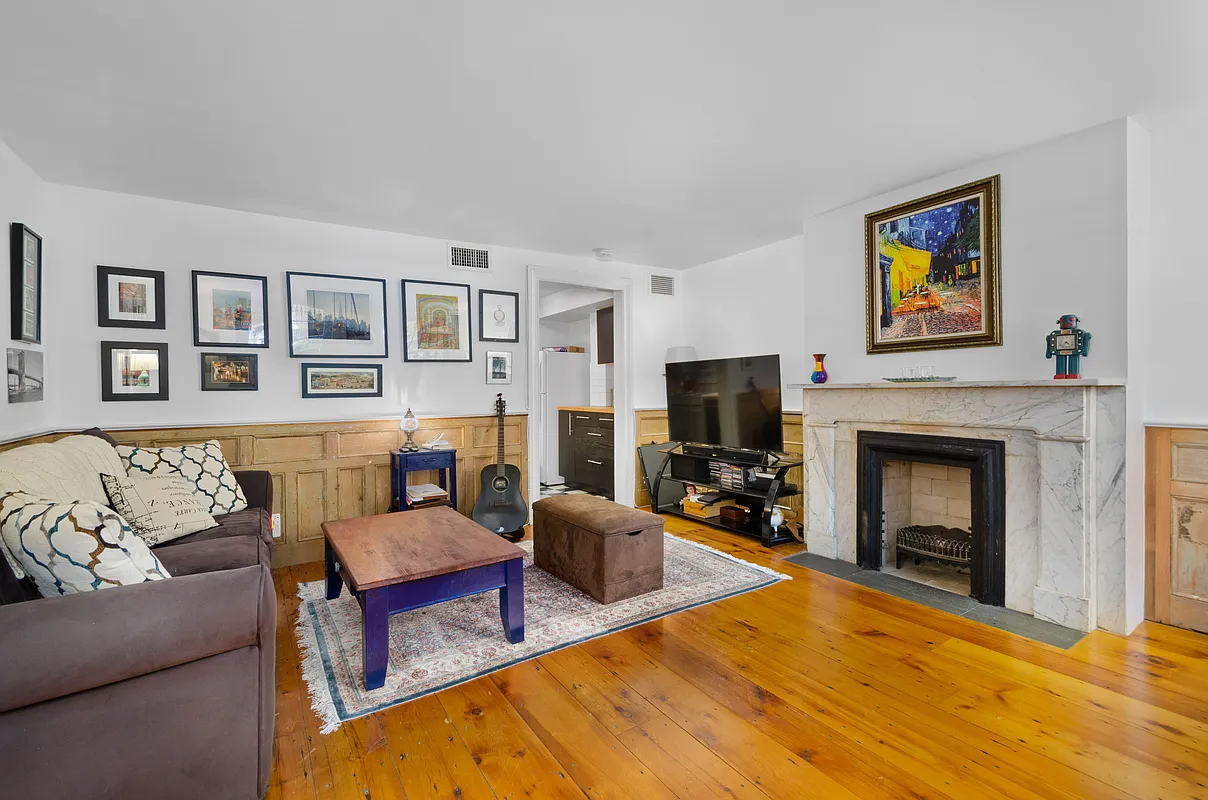
Photo by simplerich


“there are buyers on the sidelines this time.”
http://www.nytimes.com/2009/03/09/nyregion/09foreclosure.html?ref=nyregion
FSRQ,
I do shop around. Your numbers don’t reflect reality for multi-family apartment buildings. True, insurance costs haven’t increased dramatically in the last few years, but aside from dropping a little after having sky rocketed immediately post 9/11, they keep going up, not going down. The prices I get are the same that most landlords get.
Your point, I believe, was that fuel and insurance costs have offset the increases in RE taxes, and that just simply isn’t accurate.
The city is currently taking about 33% of gross income in real estate taxes. It’s an absurdly high amount and even if there were slight savings in fuel or insurance, which there isn’t, it wouldn’t dent the nut the city is pillaging pre-income tax from NYC landlords.
oh just noticed that it looks like you can buy the annualized data from dqnews & order other custom reports by zip code (archived quarterly numbers etc). that’s pretty interesting, but I am not quite willing to fork over $100 for it…maybe after first quarter 2008 comes in.
Benson – annual numbers would be great – if broken down by zip code. Do you have a link to that info? The trouble with city-wide or even borough-wide statistics is that obviously there is a huge difference neighborhood by neighborhood in nyc. http://www.therealdeal.com had some interesting statistics for manhattan (diff between ask & sales price, etc.) but I can’t find better numbers for brooklyn by ‘hood. even if there is an issue with quarterly numbers, I think it is interesting to see the trends by neighborhood – which after all make a lot of sense (ie, not surprising that East New York and Sunset Park crashed first b/c that’s where the bulk of foreclosures happened last year). The dqnews info also has median price per square foot…so that’s helpful.
Obviously, to do the real analysis you have to get very granular. Personally, I have been looking to buy for years, so when I look at comparables on propertyshark, or the nyc finance dept for the Heights and Cobble Hill (where I’m looking), I have sadly seen most of the listings in person.
In a way, I almost don’t want to buy, because then my whole real estate hobby will end. It’s so much better than sports.
Also, I am love love loving the way brokers treat me now (and that is as good an indicator as comps). That IS priceless, as hannible notes.
As a current seller with a property in Park Slope -I took the price I would have gotten let’s say a year ago and lopped off 50K from that for my Asking Price. I also used some current comps and some comps that were roughly a year old to come up with my asp.
but I also looked around at the properties selling within a 5 block radius and realized many were insanely overpriced.
We had an open house yesterday that had a good turnout according to our brokers.
The thing that our bull vs bear arguments always skirts around is the larger implications for our society if the crash is as pronounced as it seems it might be. If it is possible for prices to decline by half without a breakdown of our financial, political and social systems and if such a crash makes it possible for other young families to buy houses then the crash doesn’t look so scary. If for this to happen a NYC in the 70’s type scenario comes to pass then buying a brownstone at “half off” will be a massively pyrrhic victory.
I truly hope for the first of these situations but I am uncertain of how such an important commodity as housing can fall so far without a concurrent fall in other standard of living indices. Anyone have a theory for how this could happen?
The other very interesting thing to note is that 11215 sales volume INCREASED 5% while prices dropped 26%.
Meanwhile in 11217, Sales volume decreased 29% while prices rose 2.8%.
Obviously these quarterly numbers (as Benson said) are not reflective of the big picture, but I find them interesting nonetheless.
Iron Balls –
Heating Oil is down approx 30% year over year (true not as much as spot prices) and since in most buildings this is the largest expense its decline offsets RE tax increases (albeit this year and oil may yet rise again)
see :http://www.nyserda.org/Energy_Information/nyepd.asp
and Insurance (overall inc Liability) is DOWN – almost 40% – it was running close to $500 a rm in a decent outerboro building (inc lead paint) and is now closer to $300 a rm. If you arent benefiting you should shop around.
Oh sorry…I see it went up 2.8%. Nevermind.
The market is tanking.