
Last Week's Biggest Sales
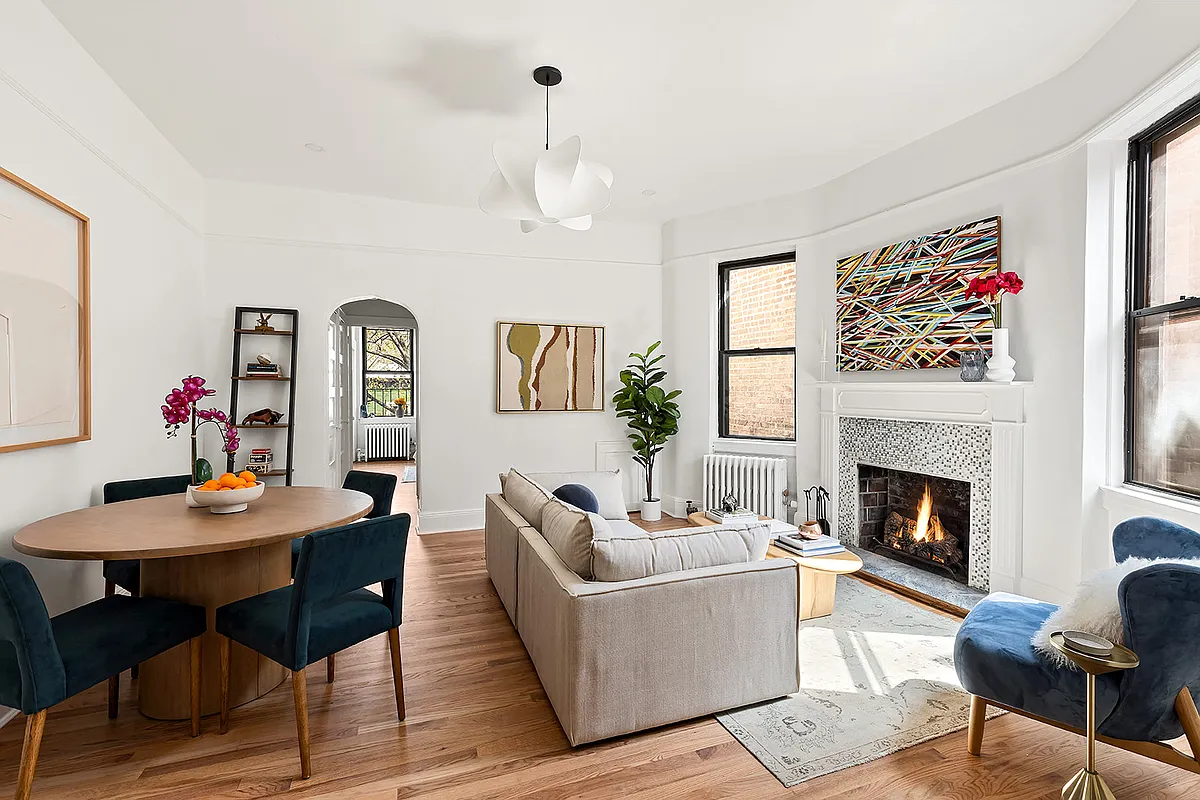
1. BROOKLYN HEIGHTS $3,895,000 80 State Street GMAP (left) This 4,550-sf, 2-family was first listed for $4,950,000 in late 2008, according to StreetEasy, and the price was cut a number of times until it was asking $3,895,000 last September. Ad said: “Rare opportunity to own a 25-foot-wide Gothic Revival 1850’s Brooklyn Heights townhouse with original…

1. BROOKLYN HEIGHTS $3,895,000
80 State Street GMAP (left)
This 4,550-sf, 2-family was first listed for $4,950,000 in late 2008, according to StreetEasy, and the price was cut a number of times until it was asking $3,895,000 last September. Ad said: “Rare opportunity to own a 25-foot-wide Gothic Revival 1850’s Brooklyn Heights townhouse with original details intact. Grand double parlor with exquisite moldings and original pocket doors, three wood-burning fireplaces, and rooms flooded with superb Southern-facing light…” Its seller bought it for $3,300,000 in 2005. Entered into contract on 10/1/09; closed on 1/5/10; deed recorded on 1/27/10.
2. COBBLE HILL $3,200,000
243 Kane Street GMAP (right)
As covered last week, this renovated townhouse was originally asking $2,950,000 in ’07, but the price was raised to $4,075,000 in mid-’08. As it lingered on the market, the price was reduced several times until it was last asking $3,500,000 as of mid-’09. Its seller bought it for $1,802,000 in 2007. Entered into contract on 1/15/10; closed on 1/15/10; deed recorded on 1/28/10.
3. BROOKLYN HEIGHTS $2,995,000
20 Grace Court Alley GMAP
As previously noted this 2,550-square-foot brick house was originally asking $3,300,000 and the widget appraisal came in at $2,766,135. Its sellers bought it for $2,675,000 in ’05. Entered into contract on 11/17/09; closed on 1/15/10; deed recorded on 1/28/10.
4. PARK SLOPE $2,125,000
524 2nd Street GMAP
When this 2-family was a House of the Day in October, it was listed for $2,375,000. The reader widget guess on it was $1,952,045. Entered into contract on 11/5/09; closed on 1/11/10; deed recorded on 1/26/10.
5. FORT GREENE $1,870,000
119 Fort Greene Place GMAP
When this brownstone was a House of the Day in November, it was listed for $1,995,000. The reader widget appraisal clocked in at $1,615,042. Entered into contract on 11/25/09; closed on 1/7/10; deed recorded on 1/27/10.
Photos from PropShark.


for the premo houses in premo hoods, the rent roll ratio might not be that applicable and/or applied that consistently. we’re talking about folks who have lots of $$$ here and I highly doubt many of these buyers worry that much about covering mortgage & other monthly cashflows. If I was rich, I would succumb to nagging spouse and willing to overpaid just so she’s happy and I can watch my football in peace.
in the not so premo hoods and/or not so premo ppty, I would suspect this rent roll ratio is a metric that’s becoming more oft used. for us regular joes, decision to buy is combination assessment of how much can I cover on monthly cashflows and is the monthly diff to own vs to rent worth it.
whether that ratio is 10x or something else? don’t know but just saying this is a very valid metric that’ll grow in popularity go forward.
for folks who bought eons ago, it’s easy to not have to think about this cause prices were cheap relative to income. Prices now often test one’s margin for error tolerance cause prices are so high now. To not think about it is really gambling with one’s own financial fate
BHO –
Comps are by definition simply what other people have been willing to pay for similar housing units – thats it – not tied to rents, or income etc (granted over the longer term there is a correlation but as we have seen they are no way tied)
Rent vs Buy – what about it – in EVERY RE boom the Rent vs Buy goes out the window (we have spent over a decade where renting made much more sense than buying and in many cases still does), so what -> again over a long time there is a correlation but they get so far out of alignment that again you cant use GRM to determine individual unit valuations
that was the point I was trying to make, FSRQ….and stated earlier in thread that only investment props are priced by multiple of rent roll. BHO was asserting that multi-fam like were invest props. I concur with you.
And I don’t remember what rents were when I bought. But interest rate was like 11%
11217 – I was an owner, now a renter and my quality of life is/was fine in both cases. Same hood, actually like aspects of my rental better, and I definitely like having a super! I didn’t think the day would come, but I am now getting very bored by Bstoner, or at least the same old bull/bear argument every week. LWBS comes out, and all the bulls cheer for the outliers, then OH6ML comes out, and the bears rejoice over properties lingering, getting price cuts, etc. From my perspective, the risk (as a cash-flush buyer) is still overpaying. I don’t see any economic fundamentals to support significant price increases anytime soon so I think a bull’s best case scenario is stabilization and flattening – which, for a bear, means there is no rush (mind you, I’m still actively looking and will buy when we find the right thing at right price, regardless of “market cycle”). Yawn.
“11217 – nice way to throw in the towel”
You’ve thrown in the towel long ago by not answering the questions posed and by not realizing that your “10 times” has to do with investment properties and “15 times” is the figure more commonly associated with individual home ownership.
But keep spouting your inaccurate figures. I’m pretty sure no one here is making up their mind about a home purchase because of your rants on rent rolls. Clearly not those who purchased last week’s biggest sales.
Owner/occupied multifamily properties aren’t that not that different than your run off the mill investment property. The rented portion of the building is an investment property just like any other.. ask the IRS.
I like Cap Rates instead of GRM, especially when it comes to multifamily Occupied/Owner brownstones. Divide GRM by 1 and that’ll give you Cap Rate. A ‘good’ Cap Rate would be the 30Yr Fixed Mortgage plus 1 or 2 points.
If your Cap Rate is less than your Mortgage Rate, you are basically giving money away on your tenants behalf every month.
Pete – what was your price/rent ratio when you bought?
11217 – nice way to throw in the towel, divert attetion to emotional factors that the appraisal for the other 80% doesn’t even condider.
fsrq – Just because Knakal didn’t include brownstones in their samples, it’s different? Brownstones aren’t your typical singlefam bungalows you see spread out through the US.
***Bid half off peak comps***
“My quality of life since home ownership has skyrocketed. It was one of the best decisions I’ve ever made. Infinitely more happy than as a renter worrying about moving/dealing with landlord/not being able to decorate, etc.”
Same for me on this front 11217. Hard to put a dollar value on that aspect but I do appreciate it.
This is an example of an INVESTMENT property – and where the GRM metric has meaning:
http://www.masseyknakal.com/listings/detail.aspx?lst=19494