
Last Week's Biggest Sales
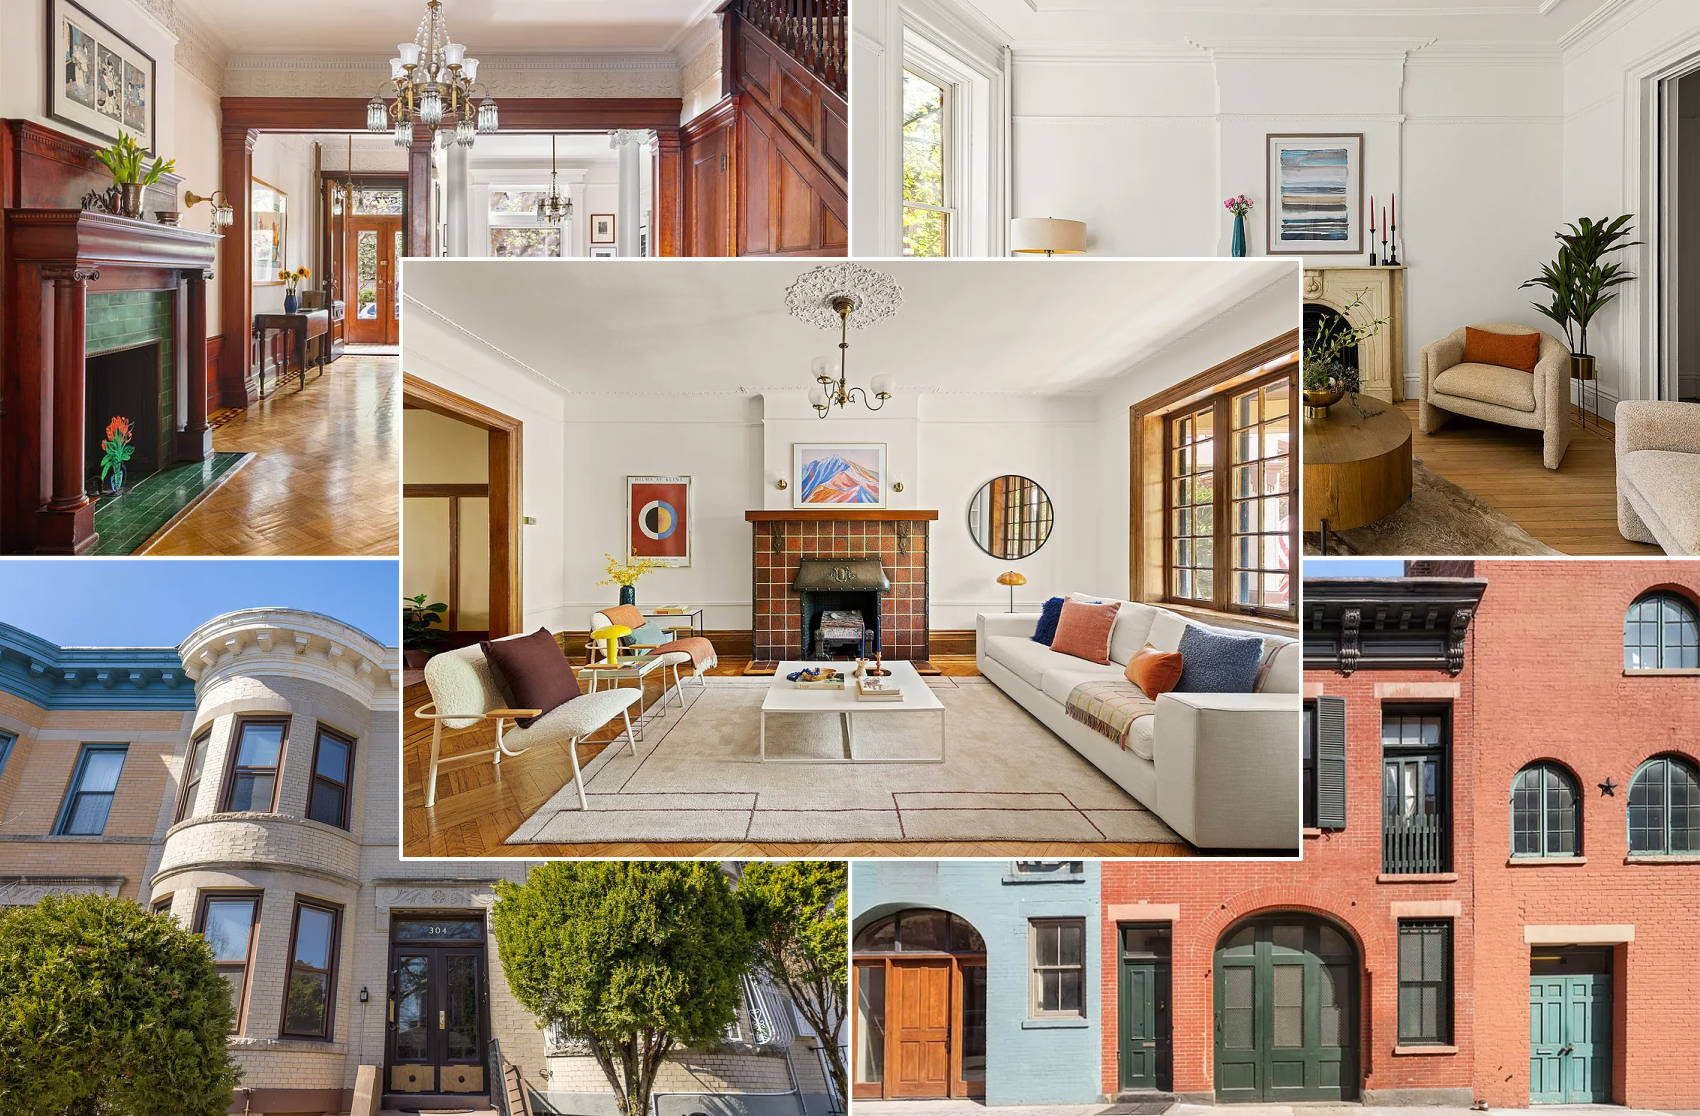
1. COBBLE HILL $3,050,000 227 Kane Street GMAP This 4-bedroom, 3 1/2-bathroom landmarked brownstone sold for $2,429,000 back in 2007. The listing says the building has a “huge country kitchen,” central air, 2 working fireplaces, and 3 decorative fireplaces: “The just-renovated townhome has everything today’s home buyer could want, enveloped in the beautiful flooring, plaster…

1. COBBLE HILL $3,050,000
227 Kane Street GMAP
This 4-bedroom, 3 1/2-bathroom landmarked brownstone sold for $2,429,000 back in 2007. The listing says the building has a “huge country kitchen,” central air, 2 working fireplaces, and 3 decorative fireplaces: “The just-renovated townhome has everything today’s home buyer could want, enveloped in the beautiful flooring, plaster and crown moldings, columns, marble mantles, and extensive details that denote the traditional luxury of an historic brownstone.” Entered into contract on 10/30/09; closed on 2/4/10; deed recorded on 2/23/10.
2. BENSONHURST $1,525,000
7819 Bay Parkway GMAP
Built in 1930, this 1-family with a garage has 2,046-sf residential space and 1,934-sf commercial space, says Property Shark. It appears that the former owner used the commercial space as an ophthalmologist office. Entered into contract on 10/1/09; closed on 2/23/10; deed recorded on 2/16/10.
3. WINDSOR TERRACE $1,300,000.00
536 17th Street GMAP
This brick row house was an Open House Pick early last month, when the asking price was $1,295K. But the listing offers it at $999K and describes it as a 2-family used as a 1-family with “4+ Bedrooms, 2 Baths… Exposed Beam & Brick, Tin Ceilings Red Oak 3″ Plank Floors.” Entered into contract on 12/10/09; closed on 2/11/10; deed recorded on 2/24/10.
4. DITMAS PARK $1,298,000.00
1600 Dorchester Road GMAP
This gorgeous Victorian with a very tasteful pool was a House of the Day back in June, when the asking price was $1,525,000. Entered into contract on 12/3/09; closed on 1/22/10; deed recorded on 2/24/10.
5. MANHATTAN BEACH $1,200,000
64 Amherst Street GMAP
According to PropertyShark, this 1,944-sf 2-family home was built around 1920 and has a garage. Entered into contract on 10/12/09; closed on 2/1/10; deed recorded on 2/24/10.
Photos from Property Shark.
I’d like to point out that of the approx 90 responses to LWBS, 24 are by DIBS; who is very happy with all his choices, and secure in his opinion about the direction of the market.
“does anyone believe that the high-end of the market was somehow immune to the real estate bubble burst?
in fact, it is an explicit claim of bho that all nabes will suffer roughly equally — call it the greater domino theory of real estate, if you will. ”
Not immune, but it’s the history of all bubbles that you get a ‘flight to quality’. Consumer and pharma stocks hold up better than small caps. US Treasury’s hold up better than Greek debt. And so on.
In RE, quality also holds its value better. It’s not immune, but it declines less. In a bubble, everyone wants to live in PS, but can’t, so they end up in Bushwick. When demand falls, everyone still wants to live in PS, and now more can afford to. Guess where that leaves Bushwick.
I like the 10X rents mantra!
Antidope,
The LWBS thread is useful.
I think we would all agree on that.
The degree of its usefulness, however, is what is at issue.
How much of an indication of the general market is it?
How much of an indication is it to someone who’s looking to buy a 1.5M townhouse?
How much of an indication is it to someone who’s looking to buy an “affordable” one-bedroom?
BHO can be pretty insightful as long as he’s on his meds and not harping on the 10 x rents mantra.
Antidope,
You’re citing BHO to support your theory!?
90 posts for LWBS is pretty good.
ledbury, while i see your point, i am afraid there is no ability to compare the current inventory situation to another moment in time, so it puts us back into purely hypothetical territory. no data is good for barstool theorizing but bad for measuring reality. (let’s imagine (because we don’t have the data) how many of OHPs were sold within six months during the re peak. if we deduce that the number these days is 1.5, do you really think it was higher than 2.5 previously? not like everything was moving. there were still plenty of not serious sellers; call them askers since there weren’t bids at their ridiculous list prices.)
LWBS is only an outlier in its titled respect. by definition they are the largest transactions to have occurred. but i continue to fail to understand why they aren’t considered useful. we are measuring *comps* here, not apples and bananas. (thanks slopefarm for picking up the baton.)
does anyone believe that the high-end of the market was somehow immune to the real estate bubble burst?
in fact, it is an explicit claim of bho that all nabes will suffer roughly equally — call it the greater domino theory of real estate, if you will. there is no exquisite property exemption to the theory. as such, these data points are just as useful as comps in BedStuy, for instance.
18 houses…but how many in each neighborhood? That was my original stipulation as buyers are very particular about what neighborhood they will live in around Brooklyn…schools, status & stuff!!!