
House of the Day: 289 Garfield Place
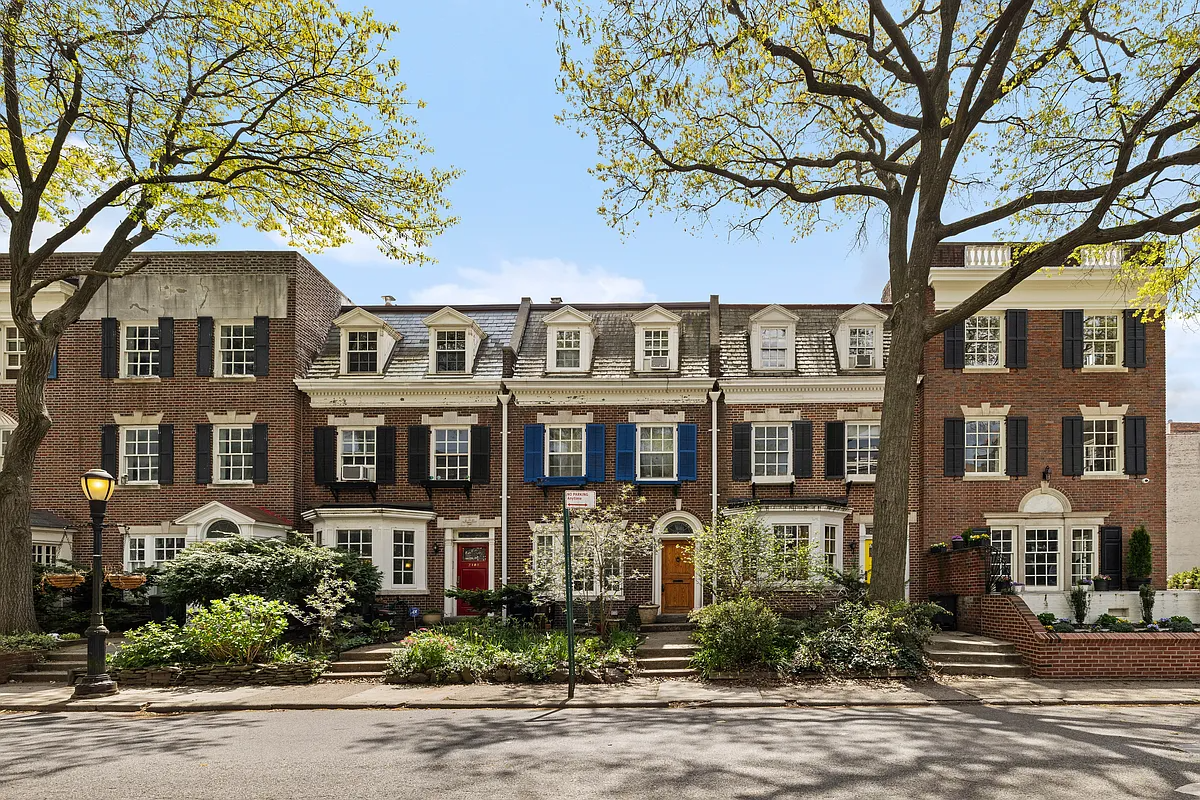
289 Garfield Place was an Open House Pick last month shortly after it hit the market with a price tag of $1,950,000. It’s a nice house in a nice Park Slope location, but it feels to us like it lost a bit of its soul when it was recently renovated. It’s also a four-family house,…

289 Garfield Place was an Open House Pick last month shortly after it hit the market with a price tag of $1,950,000. It’s a nice house in a nice Park Slope location, but it feels to us like it lost a bit of its soul when it was recently renovated. It’s also a four-family house, which takes it out of the running for a lot of family buyers. Of course, having three rentals does help take the sting out of that monthly mortgage payment.
289 Garfield Place [Corcoran] GMAP P*Shark

A lot of low ball appraisals. Even with less soul, that location’s got to get it above $1.3.
DIBS, what yellow did you use?
Well, look at it this way, manhattan’s inventory is 8,722, and the last confirmed month of sale was 743. That’s still about 12 months of inventory, and the ratio will get worse as sales go down in December and January. I am not making predictions, because who knows really?
I am only pointing out the ratio is still pointing downward.
2000-2008 was the largest housing boom this country has even seen. I’m not so sure that judging inventory numbers by those years is the best way to get to the “normal” inventory numbers…
If you look at the charts on his website, you will see that inventory numbers between 2000 and 2008 ranged from 4,000 and 7,500, with most numbers between 4,500 and 5,500, so I am not sure how he computed that average. If you are interested in accuracy, you might want to check Urbandigs; he gives a great critique of Miller-Samuel numbers.
In any case, more than the absolute numbers, it’s the ratio of inventory/sales that matters. This can change pretty dramatically, but right now it’s the slowest season. We’ll see what Spring brings.
NYTIMES:
“Inventory levels in Manhattan have averaged 7,021 a month for the last decade, he (Jonathan Miller) said.
What are you saying is a “normal” year Maly?
Because by most accounts, NYC hasn’t had a “normal” year for real estate since what…1999 maybe would you say? Although I think 2009 is turning out to be pretty normal.
I just read that inventory in Q4 2004 was 7000.
11217, especially with what the $ is worth vs euro. Not even sure winning tonight would help.
What a beautiful place, Delepp (although I’m not a fan of the light floors). But otherwise, gorgeous!
Too bad it’s in Paris. 🙂