
Case-Shiller: Recovery Waning, Double Dip Possible
Case-Shiller came out with the December numbers for its 20-city index of real estate prices and the results weren’t particularly good: 15 out of 20 cities showed month-over-month declines, though the overall index managed to eke out a seasonally-adjusted increase of 0.3 percent. The good news is that the index staged a 5 percent comeback…

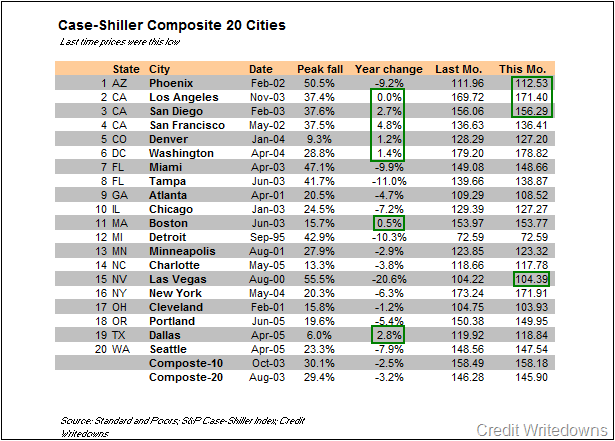
Case-Shiller came out with the December numbers for its 20-city index of real estate prices and the results weren’t particularly good: 15 out of 20 cities showed month-over-month declines, though the overall index managed to eke out a seasonally-adjusted increase of 0.3 percent. The good news is that the index staged a 5 percent comeback starting in April 2009 after a six-month run that saw it lose 11 percent. The bad news is the number of markets with positive monthly returns has gradually decreased over that time from 18 in June to 4 in December. It also doesn’t bode particularly well that the Federal Government is expected stop its purchases of mortgage-backed securities in March, which in turn is likely to lead to a rise in mortgage rates; meanwhile, market pressure from a rising number of foreclosures is expected to keep downward pressure on prices. Seeking Alpha all that means the country’s in for a double dip. Here in New York City, prices fell about 1 percent month-over-month and a little more than 6 percent year-over-year, not as bad as Las Vegas or Miami, but far worse than some other cities like Boston or San Francisco where the downturn started much earlier.
U.S. Home Prices Rise Modestly [NY Times]
Case-Shiller Adds to Confusion on Housing Market [WSJ]
Graphic from Seeking Alpha


Look, I really don’t think this should be about staring at real estate prices like one would a crystal-ball. They’re not going to tell you anything for a good long while. When was the last time this country or this city saw a recovery out of recession led by real estate speculation? It doesn’t happen in the best of times, much less when consumer credit is as constrained as it is.
The likely pattern is that a substantial recovery will be signaled by an increase in consumer confidence, followed by an increase consumer demand (often accompanied by stock market rallies and increasing money supply), followed by a substantial recovery in employment, followed by improved access to credit, followed by increased permit applications and sort, for new building, as delayed projects get underway again, anticipating the improvement. Only after that will you see any real structure or direction to this real estate market in terms of prices. Unfortunately, none of that has happened yet with any degree of confidence and possibly with a false flag or two.
Until then, anything upward will be a structureless blip, bouncing on the bottom so to speak, and there could very well be more fear-driven declines in some markets. Nothing to see here, I’m afraid.
25% of all condos within 1 mile of downtown Brooklyn have a lis pendens filed against them.
when is it gonna stop
I suppose I am saying that I think that prices will take a second leg down when the government pulls mortgage support and when the backed up foreclosures finally hit the market. I don’t believe prices will fall 65% from the peak, but then the Japanes data says anything is possible.
Chart does say 45% or so for Japan but Japanese RE institute says values dropped in Japan’s 6 largest cities by about 64% from peak and commercial about 85% from peak. I imagine Tokyo is even worse than these stats.
http://www.reinet.or.jp/docs/outline/6daitosi.pdf
Anyway even these stats can understate the carnage, average prices can fall but because the same money can now buy a better place, the average within a given category (low end, middle high end etc) can be devastated. Indices try to take that noise away by tracking only repeat sales of existing housing stock, but it’s difficult to do.
In the end, it seems to me any particular house is only worth what a banks will lend you to buy it. Cash buyers are a dream but they are a small minority, they don’t set prices, banks do in most times. When banks won’t or can’t lend, then the market is made up of cash buyers who are likely to be a) savvy about money or they wouldn’t have cash to buy and b) likely to have less to pay than a bubble buyer with a lot of no money down, teaser rate mortgage resources at his/her disposal.
Can’t live in a tulip bulb, although I would like to try.
I’m talking about real estate booms and busts.
Wasder, it all depnds on which chart to look at. The point is the price swings like pendulum. When it goes too far in one direction, it will not only swings back to historical trend but continues to the other extreme. Of course, the government intervention (buying mortgage securities, setting interest rate low, tax credits for homebuyers, etc.) may limit some of this but not by much.
Party–according to the graphic that joe in gowanus posted above Japan in the 90’s dropped about 45% peak to trough, not 70-80%.
Mopar is wrong. How much the price will go down depends on how much the price went up above historical trend during the bubble. Sometimes it goes down 20% below peak, but sometimes plunge 70-80% below peak like what happened to Japan in 1990s and Holland after the tulip bubble.
Man BHO, I was wondering where you were for this discussion. I tried to comprehend the article you posted and I guess in broad strokes I get it. There is in your article some nuance as to whether or not loan modifications will slow the rate of foreclosure and lessen the impact of the shadow inventory so I suppose the next year or so will be pretty interesting.