
Last Week's Biggest Sales
1. FORT GREENE $2,395,000 49 South Portland Avenue GMAP (left) This house sold quickly, and for more than its asking price: The large 2-family was listed for $2,200,000 in late May, according to StreetEasy. Entered into contract on 6/25/09; closed on 8/21/09; deed recorded on 9/11/09. 2. COBBLE HILL $2,225,000 132 Pacific Street GMAP (right)…

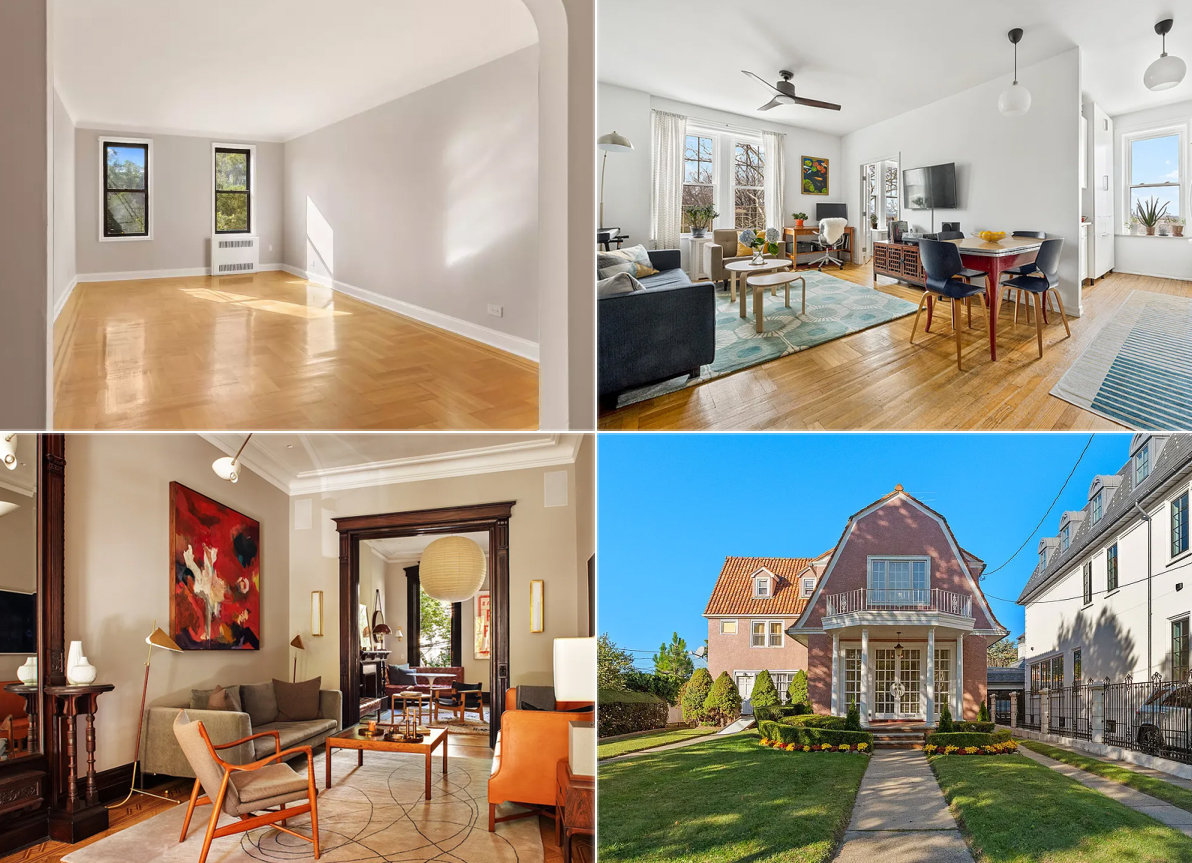
1. FORT GREENE $2,395,000
49 South Portland Avenue GMAP (left)
This house sold quickly, and for more than its asking price: The large 2-family was listed for $2,200,000 in late May, according to StreetEasy. Entered into contract on 6/25/09; closed on 8/21/09; deed recorded on 9/11/09.
2. COBBLE HILL $2,225,000
132 Pacific Street GMAP (right)
This 3,350-sf, 2-family was asking $2.75 million. Entered into contract on 6/12/09; closed on 8/14/09; deed recorded on 9/10/09.
3. BROOKLYN HEIGHTS $2,000,000
9 Pierrepont Street, #2 GMAP
It looks like this sale is probably of the large lower duplex that was a Co-op of the Day a couple of times, most recently this June, when the price had been dropped from $2.95 million (that was in April ’08) to $2,335,000. Closed on 9/8/09; deed recorded on 9/11/09.
4. CARROLL GARDENS $1,750,000
277 President Street, #1B GMAP
This 2,235-sf, 3-bedroom condo was first listed for $2,195,000 last July and was asking $1,849,000 by this March, according to StreetEasy. Entered into contract on 5/12/09; closed on 8/31/09; deed recorded on 9/8/09.
5. CARROLL GARDENS $1,745,500
355 Degraw Street GMAP
This 2-family townhouse was first listed for $1.95 million in March, according to StreetEasy. The price was cut to $1,875,000 in May. The house last sold for $1.36 million in 2004. Entered into contract on 6/19/09; closed on 8/19/09; deed recorded on 9/9/09.
Photos from Property Shark


I’m still a little surprised by that cobble hill house. that price looks cheap relative prices in that area. pic’s and flr plan looks good to me
i think the widget will get smarter as time passes because the panic seems to be abating. april mood was miserable.
i have seen condos that are 20%, maybe 25% off peak, actually. we will have more data on this category, for sure.
single families in good condition, 10-15% off.
my gut is that very few of the 1-family homes were bought at peak prices and the vast majority do not turn over that frequently (and therefore have tons of equity, even post lehman correction). certainly sellers with any options are not putting up their family’s biggest asset in this market unless i) they are picking up and leaving the best city in the world or 2) they are of the bho/brickoven/cornerbodega opinion that we are about to enter armegeddon.
antidope–I hear you. And I agree that the collective mood on this site was an over-reaction to the data available. Still, given the over-abundance of exuberance on the way up I am loathe to replicate that mood when the bleeds looks to be easing.
I’m with you wasder. I do think the data is taking on significance as to the performance of the widget vs. sale price though. Maybe my new tag should be bid widget+10%. I wonder with BHO’s and what’s hiatuses (hiati?) whether the widget will become more accurate. We’re a consistent bunch — widget is fairly consistent in how low it is, not a lot of variance and it is not wildly low.
regardless of ask, what it was bought for b4, etc, these sale prices look strong. $2M bucks is 2M bucks and in my book, that’s a serious conviction/commitment to shove that much $$$ into a residence.
DIBS, we might need to have a friendly wager on the brownstoner bottom out in Dec. Let’s discuss details on the side
I agree antidope about the resales. And why I think more possible to get that data on newish condo bldgs….
and those I have seen are nowhere near 20% drop…flat pricing is about what I have seen. Does not mean that others are not trying to sell and not able to get orig price.
SO again..anyone from these new condos…chime in with any resales in your bldg.
my $0.02.
the only way to “know” what’s happening in real estate is to catch a house (or coop) that’s resold.
that is the methodology used by CS. it leaves unresolved the fact that many homes receive upgrades/investment but it is not possible to adjust for that.
since we have so very few resales in any given neighborhood (or category), it is difficult to say anything definitively.
to me, this data says that the collective mood on this website reflected a typical market overshoot as of april.
and that was what i was saying at the time.
i was not saying it was a bottom.
The widget is silly. There are always 5 silly people who pick the absolute lowest price and a handful of people who pick well above ask, which is equally silly.
You guys are a bunch of Silly McSillymeisters.
As for these sales, it shows there is still a rather strong market for high end homes, but I would guess these prices are still probably 20% off peak. Not bad.