Last Week's Biggest Sales
1. MANHATTAN BEACH $2,150,000 34 Girard Street GMAP (left) A 5,040-sf, two-family house, according to Property Shark. Entered into contract on 1/30/09; closed on 5/11/09; deed recorded on 5/20/09. 2. DUMBO $1,815,000 100 Jay Street, Unit 29A GMAP (right) A 1,711-sf, 2-bed, 2-bath unit in the J Condo, according to StreetEasy. Entered into contract on…


1. MANHATTAN BEACH $2,150,000
34 Girard Street GMAP (left)
A 5,040-sf, two-family house, according to Property Shark. Entered into contract on 1/30/09; closed on 5/11/09; deed recorded on 5/20/09.
2. DUMBO $1,815,000
100 Jay Street, Unit 29A GMAP (right)
A 1,711-sf, 2-bed, 2-bath unit in the J Condo, according to StreetEasy. Entered into contract on 3/25/09; closed on 5/8/09; deed recorded on 5/21/09.
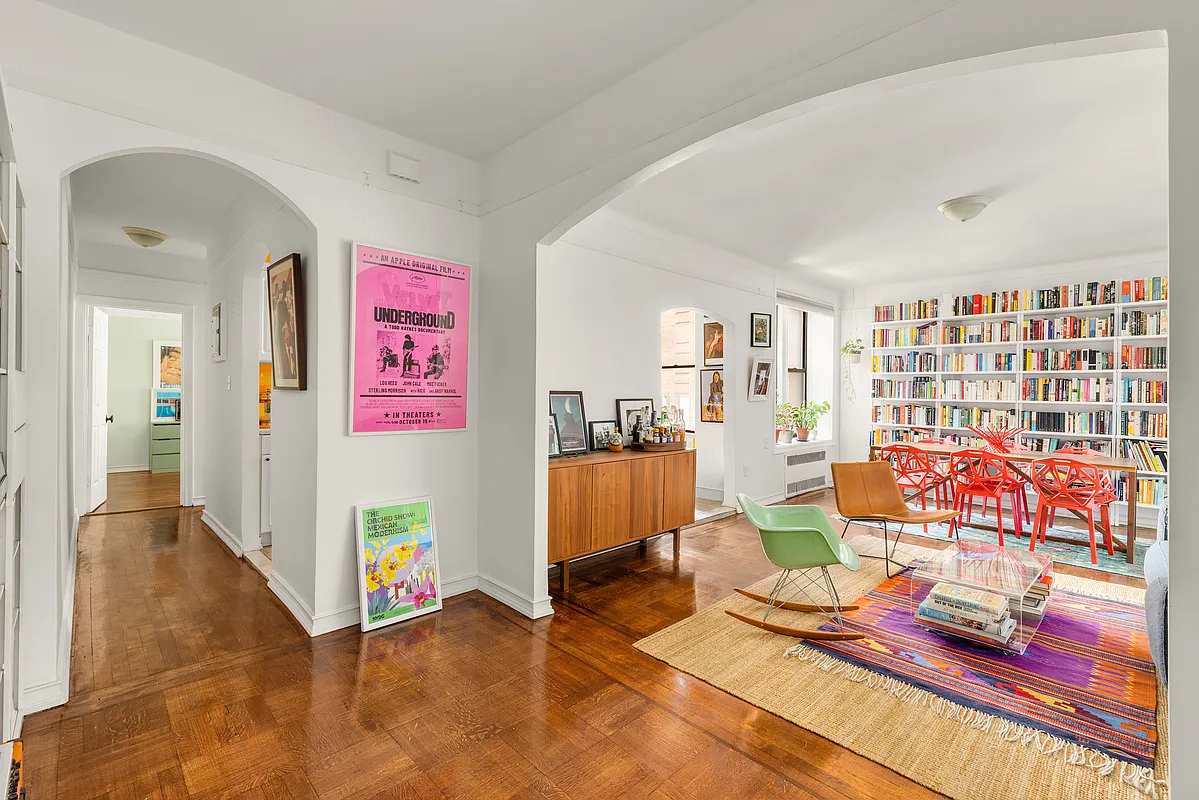
3. CARROLL GARDENS $1,400,093
277 President Street, Unit 3A GMAP
Another big closing in this condo conversion, where one of the buyers has been blogging about their purchase. Entered into contract on 5/5/09; closed on 5/5/09; deed recorded on 5/19/09.
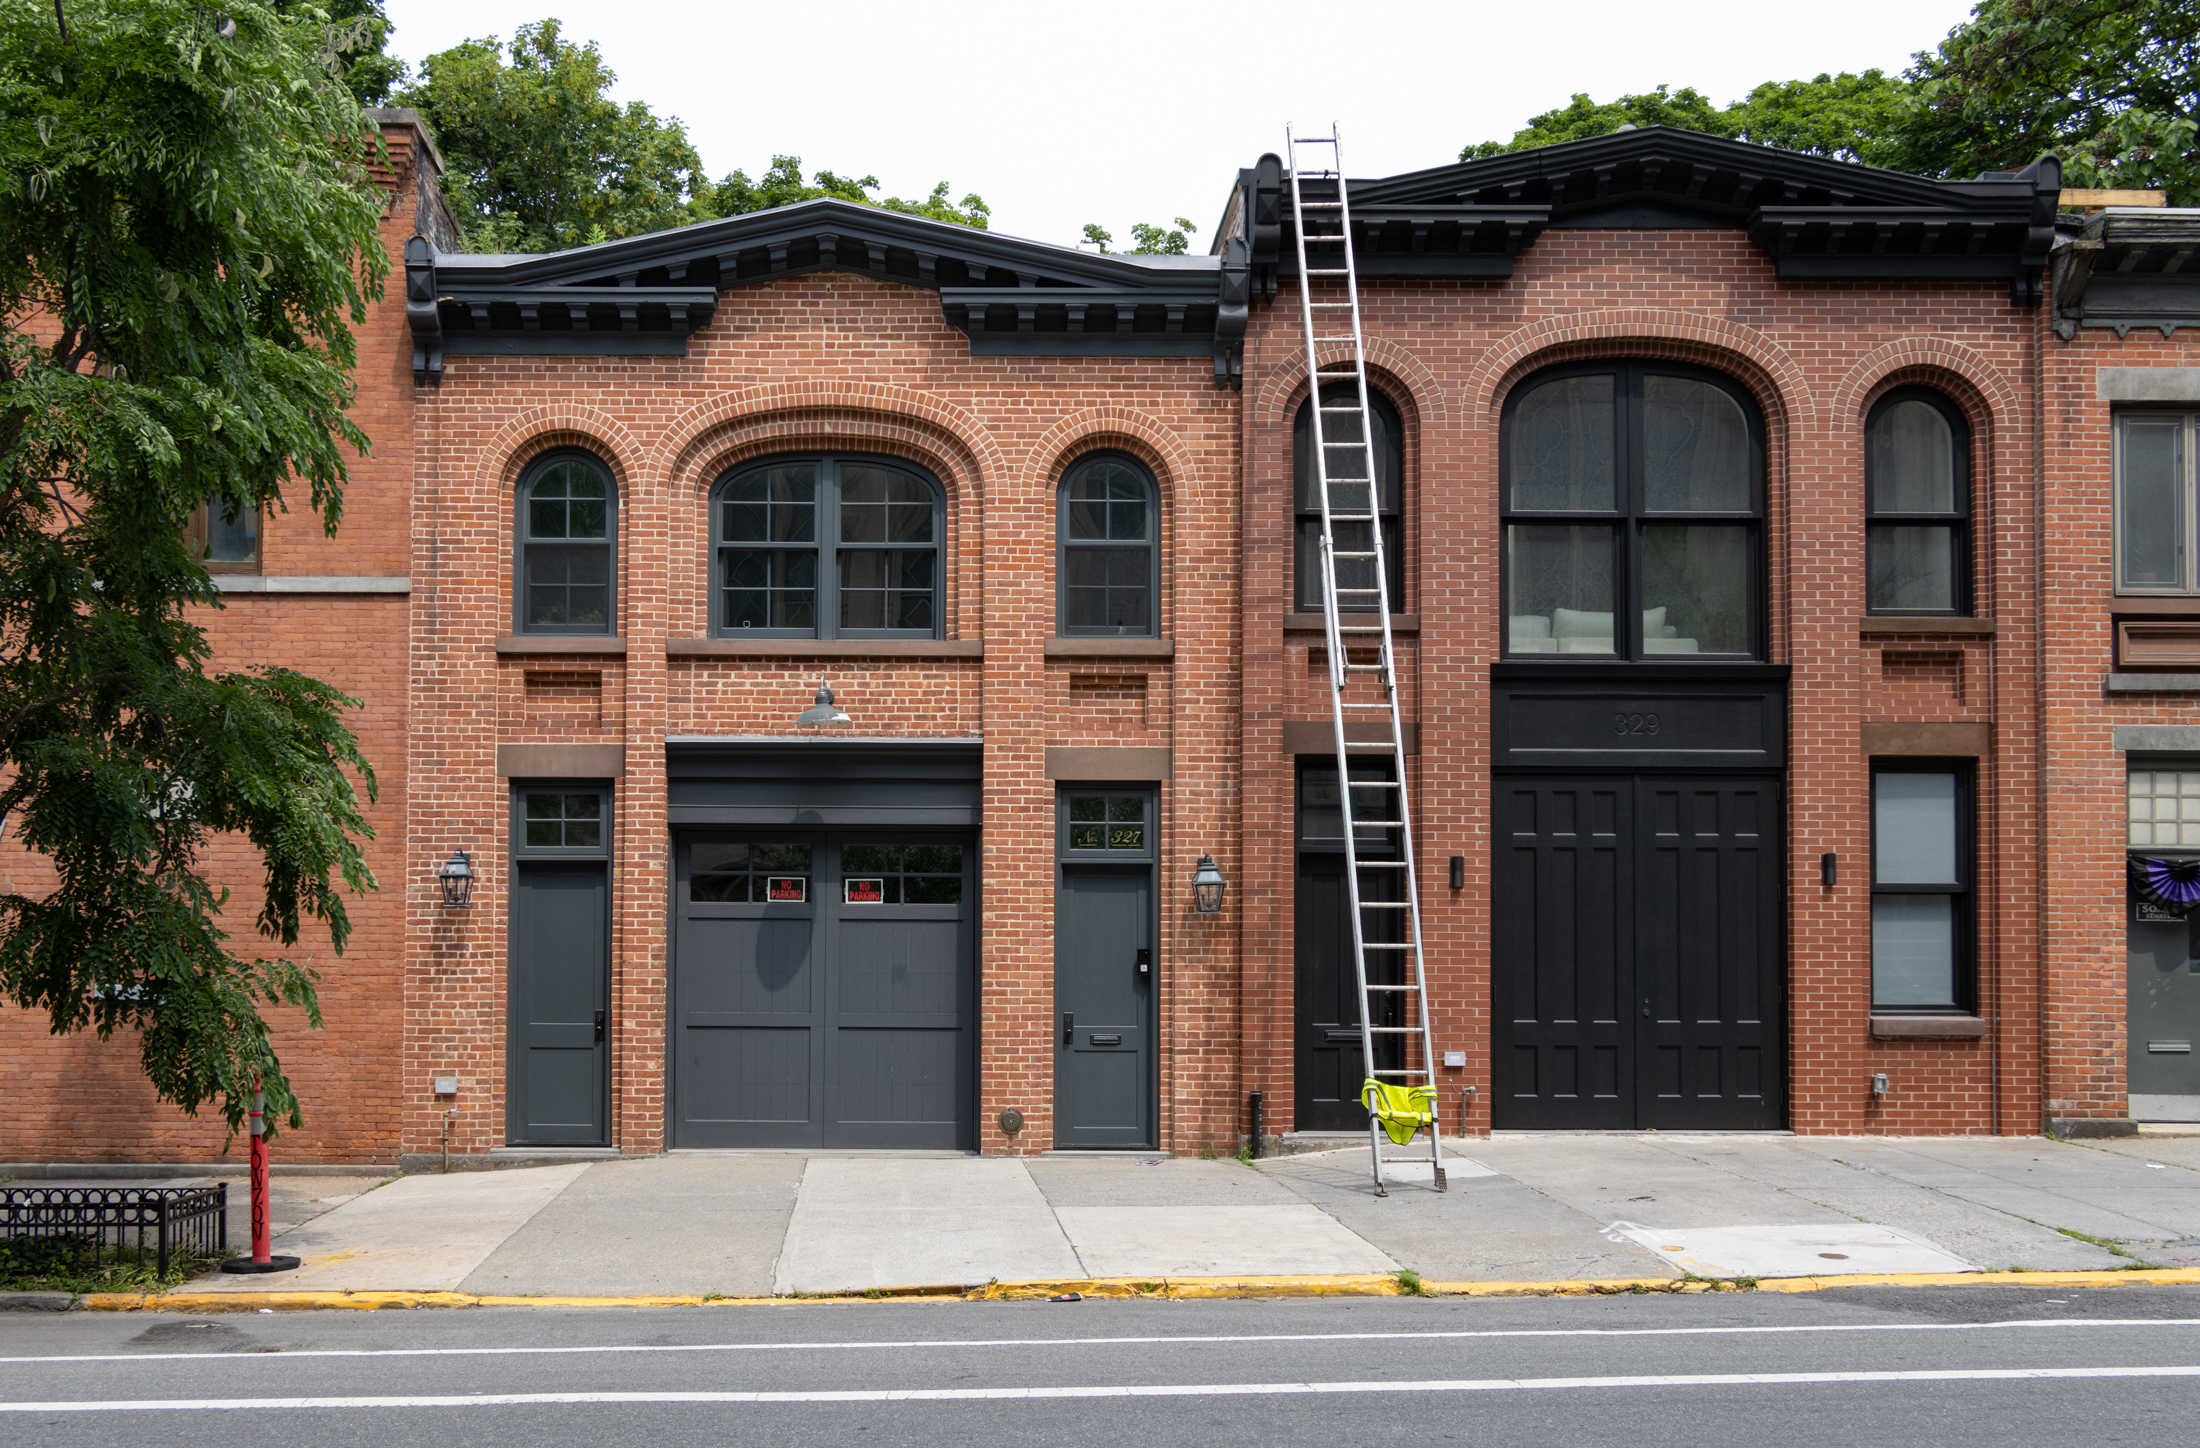
4. BOROUGH PARK $1,100,000
1256 44th Street GMAP
A 5,250-sf, 5-family, according to Property Shark. Entered into contract on 11/5/08; closed on 5/7/09; deed recorded on 5/20/09.
5. BENSONHURST $990,000
1633 79th Street GMAP
A 3,280-sf, 4-family, according to Property Shark. It last sold for $610,000 in 2003. Entered into contract on 1/15/09; closed on 5/8/09; deed recorded on 5/21/09.
34 Girard Street photo from Property Shark; JCondo photo by The Real Janelle.


Amid all this lofty intellectual hothouse debate, is no one going to point out the architectural loveliness of the $2.1 mill Manhattan Beach house, which appears to be the result of a literal train wreck in which one McMansion rear-ended another?
Santa will not be coming down your chimney, DIBS. You haven’t been good. Your neighbor (William Thompson) and Cuomo are all over your ass for f’ing with our state pension dough.
***Bid half off peak comps***
Christmas is coming too, BHO. No chimney for Santa to come down in your rental.
“different”
Very dangerous word, mopar. We never learn.
“poor areas are the *first* to fall and the *last* to recover. Hence prime Brooklyn should bounce back sooner”
That I can agree with. African-Americans are first fired (recession) and last hired (recovery). But we were debating NYC proper vs NYC Metro, income being equal. History and logic show that the burbs will recover first.
***Bid half off peak comps***
Hey assclowns…
Did you miss the heading?
How bad could things be if people are paying 2 million in Manhattan beach and 1 million in Bensonhurt. Not exactly brownstone Brooklyn.
Team bear takes a grizzly dump pie in the face.
tee hee hee…
the is getting interesting…
Someday this bore is gonna end.
Petebklyn is right about condo resales. Friends who bought in 05-07 are dying right now.
Also think whether Case-Shiller lags is sort of irrelevant. I too think peak in NYC was in mid- or late 07, but it is a better gauge of the broader market than the bogus realtor “statistics” they trot out every quarter.
But…will brownstones really fall 50% from the 2006 peak? Maybe in outer Bed-Stuy, but overall I suspect not, but only because I think they’re much more desirable now than in the early 90s. The city is safer overall, and more important, brownstone neighborhoods are, too.
1992 was a different world. Also, everyone says that poor areas are the *first* to fall and the *last* to recover. Hence prime Brooklyn should bounce back sooner. Though I notice quite a bit of sales activity in Bed Stuy and Park Slope. But that’s anecdotal.
“Except prices will probably go up sooner in prime areas of New York City than they will in the whole metro area.”
History disagrees with you, mopar.
NY Case-Shiller Home Price Index
DATE, READING, CHANGE FROM BOTTOM, CHANGE FROM PREV YR
May-90 79.05
Jun-90 78.96
Jul-90 78.78
Aug-90 78.21
Sep-90 77.41
Oct-90 76.80
Nov-90 76.14
Dec-90 75.60
Jan-91 74.59
Feb-91 73.69
Mar-91 72.87
Apr-91 72.29 (BOTTOM – retroactively called)
May-91 72.63 0.47% -8.12%
Jun-91 73.50 1.67% -6.91%
Jul-91 74.39 2.90% -5.57%
Aug-91 74.90 3.61% -4.23%
Sep-91 75.06 3.83% -3.04%
Oct-91 75.01 3.76% -2.33%
Nov-91 74.84 3.53% -1.71%
Dec-91 74.74 3.39% -1.14%
Jan-92 74.59 3.18% 0.00% (RECOVERY)
Brooklyn’s brownstone belt (and all its prime) didn’t recover from the 80’s/90’s crash until well after 1992.
Logic also disagrees. First to fall (bottom out), first to recover (bounce from bottom).
***Bid half off peak comps***
I am waiting to read more of the resales of newer condo bldgs – where many people of speculated we will see bigger declines. Or even houses, but those are harder to figure because don’t know when/if/quality of renovations or upgrades.
So even though I believe prices have gone down some…then I see the J condo resale here – for $1.8m which sold in 2007 for $1.5. So I ask, please , if you see resales at declining prices please post. I think prices have gone down…I want to see the evidence.