
HMS: Prices Continue to Fall in Brooklyn
The appraisal firm HMS Associates came out with its second-quarter market report last week and, unsurprisingly, it showed that prices are down from both last quarter and the same period last year. The firm says the average price in Brooklyn in the second quarter of 2009 was $548,560, 18 percent less than $670,419 in the…

The appraisal firm HMS Associates came out with its second-quarter market report last week and, unsurprisingly, it showed that prices are down from both last quarter and the same period last year. The firm says the average price in Brooklyn in the second quarter of 2009 was $548,560, 18 percent less than $670,419 in the same period last year. The average price in the first quarter was $589,135. While there was an uptick in sales volume in the second quarter as compared to the first—545, an 8 percent increase—there were half as many sales as in Q2 2008, when 1,145 were recorded. Prices were down in almost every neighborhood tracked by the report. The biggest losers were Dumbo/Downtown Brooklyn/Boerum Hill, where prices fell 22 percent to $754,000, and Sheepshead Bay, where prices also fell 22 percent, to $263,200. Click through for the full press release.
Getting a Jump on the Q1 Post-Mortems [Brownstoner]
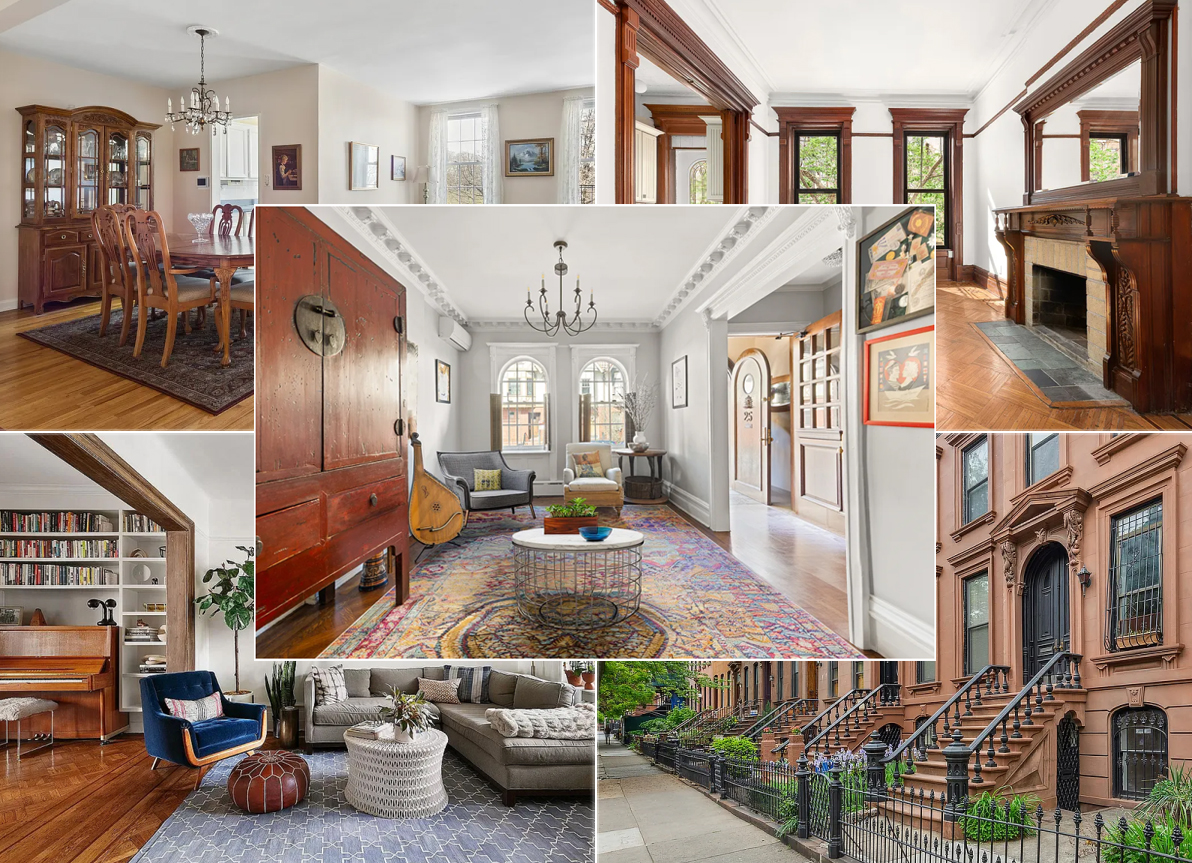
Photo by the stella
BROOKLYN HOME PRICES FELL 18 PERCENT IN 2nd QUARTER, CONTINUING DOWNWARD TREND IN PRICES
Price declines shown in virtually all Brooklyn neighborhoods,
But rise in sales volume from 1st quarter to 2nd quarter shows slight pickup
New York, N.Y., July 2, 2009 The average Brooklyn home price declined 18 percent in the second quarter of 2009 compared to the same period last year, but sales volume picked up slightly in the second quarter compared to the first quarter of 2009, according to Brooklyn-based real estate appraisal firm HMS Associates.
The average home price in Brooklyn during the second quarter of 2009 was $548,560, 18 percent less than $670,419 in the same period last year, the HMS report showed.
There were a total of 545 sales during the second quarter of 2009, an 8 percent increase in activity over the first quarter of 2009.
Prices continued to decline, which is no surprise, but there was a slight pickup in the sales activity from the first quarter to second quarter of this year so far, said Sam Heskel, an appraiser and executive vice president of HMS Associates. Because sellers have been more realistic and prices have come down, we are seeing more activity as buyers feel more comfortable making offers.
This could indicate that the market is bottoming out and that the downward trend is approaching its end, Heskel said.
Volume is still dramatically down from last year, HMS reported. The 545 sales in the second quarter of 2009 is 52 percent less than the same period last year, when there were 1,145 sales.
The price drop was consistent in virtually every neighborhood in Brooklyn, marking a difference from just a few months ago when the borough’s average price fell but some neighborhoods were still seeing modest price increases, the HMS report showed.
In Carroll Gardens/Cobble Hill, where prices were still increasing last quarter, the average home price was just 1 percent higher compared to the same period last year, and sales volume was down 62 percent. In Greenpoint, which also showed price increases last quarter, the average home price dropped 20 percent and sales volume was down 15 percent.
If you are able to come up with the financing, there is a lot of inventory out there and lower prices in neighborhoods that are still very strong, so it can be a good time to buy, Heskel said.
The home price figures and sales volume come from HMS’s comprehensive quarterly study of 15 representative neighborhoods in Brooklyn and include one-, two-, three-, and four-family homes, condos, and co-ops. The neighborhoods included in the report together are deemed a fair reflection of what is happening in the Brooklyn real estate market as a whole, according to Heskel.
Almost every neighborhood saw a price decline, the quarterly report showed. The only exceptions were Carroll Gardens/Cobble Hill, with its 1 percent increase to an average home price of $933,438 and Fort Greene, where the average home price remained statistically the same at $911,538.
The steepest price declines were in Dumbo/Downtown Brooklyn/Boerum Hill, where prices fell 22 percent to $754,000, and Sheepshead Bay, where prices also fell 22 percent to $263,200, according to the report.

Ditto, not to mention the subways constantly clattering above your head all day and night…I never understood it, but I guess someone’s gotta like it.
I don’t get DUMBO. Its a tiny oblong dominated by big polluting roads on three sides which spew their dirt and pollution straight down into the neigborhood. Its fine to visit and take a stroll in the park there, or pick up some hot chocolate at Jacques, but live there….
I am glad in a way that prices in DUMBO are way down. People paid too much to live there merely because it was all-young and all-rich. A lack of diversity in terms of age, race, and class should not be seen as a positive thing.
“Notice one thing BHO, the Retards are no where to be found!”
Peekaboo @ 10:55.
“Seems to be taking a very, very long time to come down, BHO.”
I’m about to sign a lease for 1,500 SF at the same rate per as my current rental. Wife’s very happy. In-laws now get the housing bubble. I will win.
I suspect your ‘Half off peak comps’ just ain’y gonna happen.”
Pure hope and desperation. No analytical substance.
“BHO, I’ve read your other posts and I remain curious what data you interpret to forecast 1/2 off peak comp values and in what neighborhoods, at what price/sf.”
Historic prices move with historic inflation, 4% per annum: (1.04)^10(approximate years between last trough to last peak) = 1.5, not a factor of 3(prices actually tripled). Years between peak to trough is debatable but the overshoot factor takes care of that. Half off.
This graph (Peak @ 200, Historic Mean @ 100): http://tinyurl.com/g9vf4
10x[Annual Rent(dropping, BTW)], a widely accepted ratio, puts brownstones at half off or worse.
3x[Income(both employment and rental incomes dropping, BTW)], another widely accepted ratio, arguably puts brownstones at half off or worse.
And gut feeling. How can something be speculated times 3 and not collapse by at least half? There’s no free lunch. The bigger the boom, the bigger the bust.
I’m predicting half off accross the board but maybe, POSSIBLY, worse in the lower-income neighborhoods (first fired, last hired – sad). The price difference between Park Slope and Bed Stuy was already built in before the bubble. Both increased +200%. Why not both go down at least -50%?
My not-so-sure suspicion that the lower income nabes will fare worse plays into my opinion that the best brownstone value will be had in Bed Stuy (most abundant stock in Brooklyn). I think there will be a tremendous downward overshoot there and subsequent undervaluation. Park Slope will have the worst value (too established, too easy to pick).
***Bid half off peak comps***
“What, looks like the Retards are all gentrifying the hood I mean Fort Greene, where prices have stayed the same.
Posted by: denton at July 6, 2009 11:39 AM”
Here’s a dirty little secret Denton– Those 2.6 million dollar Brownstones, the Owners are NOT paying the mortgagees! The genius cannot come up with the 17,000 mortgage payments. It’s over and say Good Bye..
The What
Someday this war is gonna end…
“Notice one thing BHO, the Retards are no where to be found!”
What, looks like the Retards are all gentrifying the hood I mean Fort Greene, where prices have stayed the same.
doug: you better be selling several houses upstate if you want to buy one in Brooklyn. The house prices here are still quite high.
I agree with Petebklyn,how can they say that 1 nabe with similiar housing stock, same schools and amenities has declined 22% to the nabe literally 2 mins away?
Brooklyndoug – I would say if you have Park Slope or Carrol Gardens money, those are the two safest neighborhoods where you will most likely see your home’s value appreciate rather quickly.
I am a newbie to Brownstoner but not to buying. I’ll be selling my second home in upstate NY and finally coming home to metro NYC.
BHO, I’ve read your other posts and I remain curious what data you interpret to forecast 1/2 off peak comp values and in what neighborhoods, at what price/sf.
Other than that — who wants to throw a newbie some info about which neighborhoods offer best combination of safety/value and price appreciation potential.
I’ll have 20-30% down payment and am highly qualified so I’m going to be some Brooklyn sellers’ dream come true.