Furman Center's State of the City Report: Brooklyn
The Furman Center has just released its State of the City Report for 2008, and there’s some interesting data about how Brooklyn’s residents and housing stock are faring: Housing indicators suggest that the Brooklyn housing market fared relatively well through 2007. In Brooklyn, the only housing type to experience a drop in prices in 2007…


The Furman Center has just released its State of the City Report for 2008, and there’s some interesting data about how Brooklyn’s residents and housing stock are faring:
Housing indicators suggest that the Brooklyn housing market fared relatively well through 2007. In Brooklyn, the only housing type to experience a drop in prices in 2007 was 24 family buildings. Brooklyn has the City’s second most expensive single-family housing stock. Brooklyn was one of only two boroughs to see a rise in new residential building permits in 2007. Home ownership in Brooklyn declined slightly from 32.3% in 2006 to 30.6% in 2007.
Despite its resilience in 2007, Brooklyn may not be immune to the effects of the housing market downturn in the coming years. Lending and foreclosure trends in Brooklyn are much the same as in the rest of the City: the borough experienced declines in all lending activities and increases in notices of foreclosure. Brooklyn had the second highest foreclosure rate of all the boroughs, with 22.4 notices of foreclosure per 1,000 14 family properties in 2007. Brooklyn also had the second highest rate of serious housing code violations: 61.4 per 1,000 rental units.
Here’s one interesting tibit we picked up: Only 17 percent of the housing stock in Greenpoint and Williamsburg is owner-occupied while in Fort Greene and Brooklyn Heights it’s more than 40 percent. Lots of other stats in the Brooklyn section of the report.


So true, Miss Muffet. But I’m wondering if FG’s price theory works in places like Park Ave. I would consider some of Brownstone Brooklyn to be moving into that category…”luxury” housing and such.
Maybe no one is reading this anymore, but I love Finance Guy!
Benson, I did not see you taking aim at me here, but DIBS, did you not see that even Benson conceded he got blown away by Finance Guy (who called his errors).
I know there are Team Bear members (I won’t name names) who seem to gleefully gloat about the market starting to tank, and while they may be right in substance, their style infuriates Team Bull & the few out there who call themselves Team Reasonable (yes there are going to be big declines but let’s not rub it in). But Finance Guy offers a cool, rational, lucid explanation as to why big declines – yes, perhaps up to 50% – are entirely plausible, if not very likely (or perhaps inevitable).
FG, re location, public schools, urbanization and all that being reflected in rent — it seems it is. For example, rents are very high in Park Slope and parts of Manhattan and they are low in Bed Stuy even though the apartments themselves are far superior than in other areas.
Also, I would guess that an 800-sf two bedroom in Park Slope would probably rent for $3,000. So a price of $1.6 million would not be unreasonable. (I’m including operating costs, but not down payment, because you get that back and more when you sell the place.) Some buildings in Park Slope are in this price range. Some go up to $3 million and are single-family houses.
Another factor is that you also have your millionaires, people sitting on piles of cash, Wall St. guys and such who at least in the past don’t seem too concerned about rents, though I’m sure they must worry about whether they are making a “wise investment” that they can sell later for a profit.
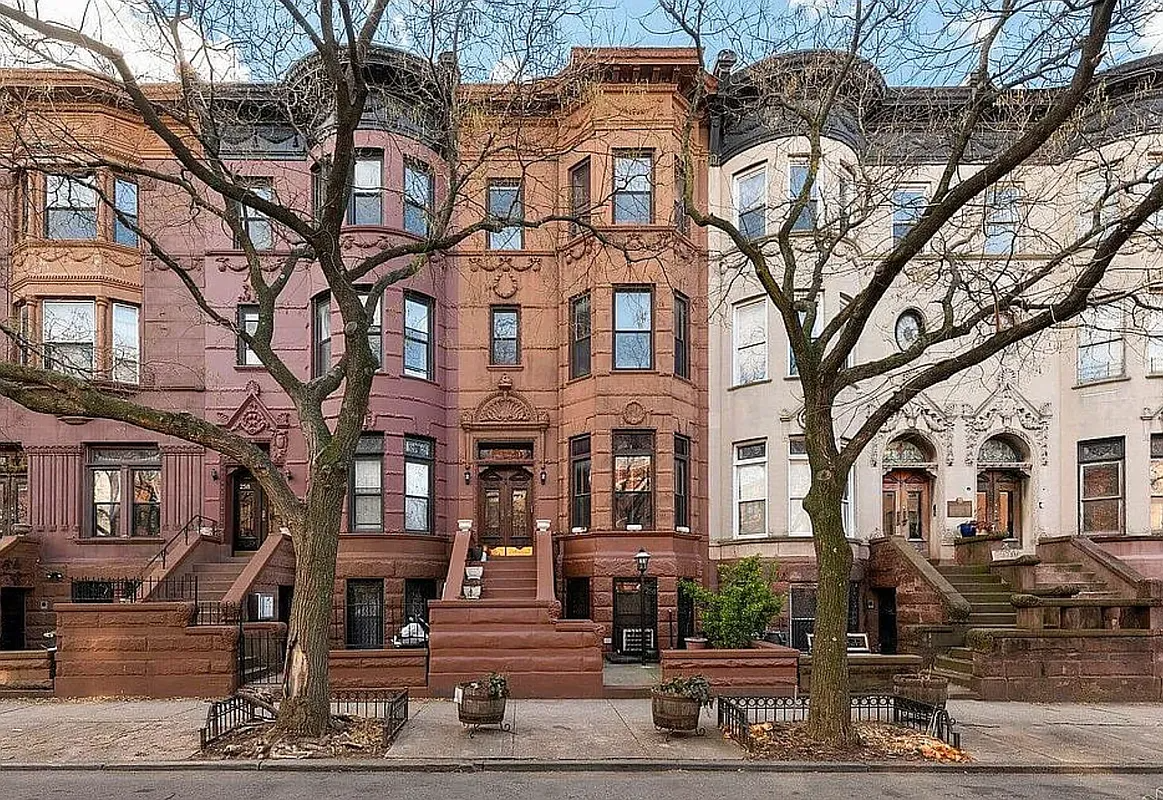
My point is that Brooklyn prices do already cluster around the rent/buy ratio you mention. On one end, in Bushwick and such, the houses cost less than renting. At the other extreme in Brooklyn Heights, they cost more (if you could even rent a single family townhouses).
My point is also that there is no law that says prices have to hew to rents. Prices will be whatever buyers and sellers agree on and there can be all sorts of irrational factors, one of which you identified — the idea that people think paying more is the path to riches.
I’m also not saying prices won’t come down.
Benson:
1. Improvements, renovation. This is a real issue. Clearly, part of the aggregate rise has to be improvements in the housing stock; the question is how much. Nationally, we have reasonable statistics: the total amount spent on improvements is something like 10% of the price rise. So nationally, we know that isn’t a big part of the bubble.
Locally, we don’t have any good detailed statistics to start with. But there is no evidence I know of suggesting that NYC has had proportionally more renovation than the rest of the country.
Absent better info, I think the best way to adjust is to compare comparable rentals to sales. If you use comparable rentals, you are already adjusting for changes in quality.
2.Comparing to the rental market. One of the strongest indicators of the bubble is that **market** rents have followed inflation (with some minor variation–e.g. Ft Greene–to reflect quality changes), as we’d expect, but ownership costs have gone up much faster.
It is hard to get any more specific than this using aggregate numbers; mostly the numbers you’d want don’t exist.
So I’m suggesting a “retail” level comparison: ask yourself what the particular place you are looking at would rent for and then compare.
Would a long term investor, expecting to be paid for work and risk (including downpayment), be willing to buy this place if he/she/it expected to get this rent and have these expenses — without taking into account the possibility of selling it to someone who isn’t making this calculation. That’ll give you the equilibrium price.
3. Rent stabilization. Rent stabilization probably makes the (market) rental/sale comparison work better in NY than elsewhere. In other parts of the country, it is hard to find quality rentals, so the upper middle class is forced to buy. Here, stabilization increases both demand and supply. Stabilization makes renting safer and therefore more attractive for long term tenants with choices. This pool of affluent tenants makes it more attractive for landlords to provide “luxury” rentals. Moreover, new construction/major renovations usually start at market, so if stabilization actually keeps rents below market (evidence suggests it does NOT, except in relatively short periods), it would also make creating new rentals more profitable.
The upshot is that NYC, unusually, has a vibrant rental market in all sectors. So you don’t need to adjust as much for the thinness of the upper end of the rental market. (I usually do anyway: I’m more sure what the rental value is of a floor-through in any given condition/neighborhood than of a full house, so I usually use the floor through value multiplied by the number of floors rather than trying to guess what the rent would be for a big unit.)
The more developed upperclass rental market also means that imbalances are less likely to last forever: even people who “have” to live in a newly renovated mansion can rent if the prices get too out of whack.
4. Monster bubbles. This is a monster bubble by any measure — one of the biggest in Shiller’s data. We won’t imitate Tokyo and London slavishly; they just demonstrate that big bubbles are followed by big pops. Which we could figure out anyway.
5. Bubbles and high incomes. Wall St had unprecedentedly large income and also made credit unprecedentedly available to the next rungs down, and this provided the fuel for the bubble. Those fuels are gone or at least reduced.
But the bubble would have collapsed anyway; bubbles always do.
Bubbles happen when people are willing to overpay because they think the next person will overpay even more. At some point, though, the bigger fools wise up. Then the psychology changes. All of a sudden, you have to make money without selling — and you can’t at bubble prices, so prices have to come down.
Bubble prices didn’t rise because there were a lot of rich people around. They rose because people thought that spending more money on houses was the surest way to GET rich. It looked like a free lunch: the more you pay, the more you make. Pay extra to live in a good school district and make more money as a result. Live well AND get rich too. Well, not exactly free lunch. More like free banquet.
Now that they see that spending too much on houses is likely to make them poorer, they won’t be willing to spend as much. Even really rich people (ESPECIALLY really rich people) don’t like to throw away their money.
If they also CAN’T spend, because income and credit are dropping, that’s just icing on the cake.
6. Case Shiller. Case Shiller tracks the entire metro area, including vast stretches of the ‘burbs, and only tracks comparable sales of single family houses, so it is only a rough indicator of the brownstone market. Furman uses more or less the same methodology, but limits to NYC. Interestingly, the two show roughly consistent results, suggesting that NYC and brownstones actually are not separate markets from the region and the country. Both indexes attempt to control for renovations by excluding houses with the biggest prices jumps, but clearly that is pretty crude.
7. Rent/own ratios. Case Shiller don’t compare rents to housing prices, although other academics have, using national numbers.
The academic studies usually compare **median** rentals to **median** sales. They do this because the numbers exist, not because they think they are comparable. In most of the country, there is no high end rental market, so median rentals reflect lower quality units than median sales. That’s why the national studies report historic rent-own ratios in the range of 15 times annual rents. For a comparable unit, that’s way too high — any investor buying at that price would lose money.
NYC rental mix is different, and I haven’t seen an aggregate study comparing NYC rents to ownership costs on a historical basis.
The 8-10 times annual rents number I use is NOT based on good statistics. Instead, it is anecdote and
Finance Guy;
Good morning! I hope that you check in on this thread again. I was thinking about what you wrote last night, and I think there is more to the story here, as such:
-You cite the 245% rise in NYC housing price (adjusted for inflation) as a sign that we have a asset bubble here, as in the rest of the country. I can’t comment on the overall US situation, but I think you have not accounted for the entire story in NYC. You acknowledge that NYC was at its nadir in the 1970’s, and that some of this rise is due to the very significant improvement in the quality of life. However, isn’t there more to it than that? Specifically, shouldn’t there be an acknowledgement that during this 20 year period, there has been a huge influx of wealthy, home-owning folks into the city? Consequently, there has been a major improvement in the city’s housing stock. That is why I don’t understand your comment that housing should track inflation, rather than income. This would be true if the housing stock were a static commodity, but that is not the case. It is certainly arguable whether the improvement in the overall city and the rise of the welathy, home-owning class accounts for all of this 245% rise. However, don’t you agree that it must account for some of it?
-I am still not sure I buy your argument that ownership is overvalued in NYC, in comparison to the the rental market. As you well know, the rental market is highly distorted in NYC, due to rent regulation, affordability subsidies, etc. Indeed, the Furman report shows that over 60% of the rental market in Brooklyn is under some type of government regulation, and these tend to be the larger, multi-family buildings. it is my contention that this situation causes the unregulated rental market to be highly distorted. We all know the soties of how high free-market rents are, as a perusal of Craig’s List will show. Is this factor accounted for in your analysis?
-The other odd peculiarity about the NYC market is that it is highly segmented. Home ownership tends to be concentrated in the upper income segement, driven by Wall Street. When the Case-Shiller analysis is undertaken for NYC, does it use average or median NYC income, or does it account for this peculiar fragmentation? This is a question, as I don’t know how Case-Shiller is calculated.
-Sorry, I don’t buy the Tokyo argument, in terms of relevance to our situation. In 1988, the value of real estate in just downtown Tokyo was worth more than all the real estate in Canada. This was a MONSTER bubble, and I don’t think we’re anywhere near that.
Hope to have a continued discussion with you! I am planning a change in career, and hope to move into the real estate field in a couple of years. This summer I will be taking some courses in Real Estate finance at NYU (unless you are giving some classes!).
Thanks for the discussion.
Benson.
I’m with FG about the carry costs vs rental comparison. I just don’t see it.
Another excellent post FG.
1. Re location, public schools, urbanization and all that — that’s why I like the rental comparison: if those things actually lead to some scarcity value (above the cost of construction-not land), they’ll be picked up in rent. There is no particular reason why any of those factors should affect sales price but not rent.
2. Re comparing rent to sales. As Chicken notes, it isn’t fair to compare your monthly costs to rent without also including (1) the downpayment, and (2) the tax deduction. The downpayment costs money. The owner is taking a bigger risk than the mortgage bank, so the downpayment should be earning more than the mortgage.
To compare to rents, you need to include all the costs of ownership — mortgage interest (not principal), taxes, heat, insurance, repairs & maintenance AND implicit interest on your downpayment, using a rate at least as high as the mortgage interest rate. Then, reduce this by the tax subsidy (not the entire deduction, but the amount of taxes it saves you).
3. What interest rate to use. Chicken is right that the calculation is sensitive to interest rates. If you are trying to determine whether prices are reasonable now, then you need to use the rates now.
But you may want to use a somewhat higher rate to protect yourself against the snap-back problem: current rates are obviously unusually low, and it is safe to assume they will be higher when you sell (which will make your equilibrium sale price lower).
4. This is an analysis of equilibrium prices. Markets, even more efficient ones than NY real estate, don’t spend much time at equilibrium.
The real estate bubble was obvious in 2002, but it kept growing for another 4 or 5 years. If you invested in 2002 assuming that prices would return to equilibrium you would have had a long period of misery and a lot of “bitter renter” taunts — and you’d still be way behind the bubble’s true believers.
There is no guarantee that prices will drop to fair value this year. Or that prices will stop dropping when they reach equilibrium.
5. Real numbers — You can plug in your own numbers, and if they show that we are at equilibrium, you should assume that drops below that will probably correct in the not too distant future. If the same is true nationally, that also would imply that the current crisis is just a liquidity crisis or a panic and that the bank rescue should end up costing the taxpayers nothing at all.
But using the returns real estate investors usually demand, $2500 for a floor-through rental — is that still a reasonable Park Slope rent for a nice 800 sft place? — implies an equilibrium purchase value of around $1.25m (~$400/sft) for a four story brownstone in similar condition and location. I’m not seeing that.
6. Comparing to construction costs. I meant construction costs, not land. Land is circular: in a bubble market, the price of land goes up because buyers expect to be able to sell the house for more. To then say the house is worth more because the land costs more is a perpetual motion machine. That’s the kind of magic thinking that caused this disaster in the first place.
Wow Finance Guy your analysis was pretty impressive. Thanks for pointing out that the Furman index was inflation corrected. That inflation correction throws benson’s rather insulting comment about perspective @ MM ( RE rise of only 4%/ year over the last 20 years) right out of the window….trop drole:)
The Chicken, this is true and funny:
“The goalposts appear to have moved for Team Bull from “house prices are going up”, to “house prices will be flat”, to “house prices will only be slightly down”, to “house prices will not fall 50%”.