
Corcoran '07 Market Report: Brooklyn's Still Up
The Corcoran Group released its year-end market data today, and the brokerage’s stats show the ’07 Brooklyn market making healthy (if not huge) gains over 2006. The median sales price on all condos and co-ops was up 7 percent last year, to $590,000, while median townhouse values rose 2 percent in ’07, to $1.2 million….

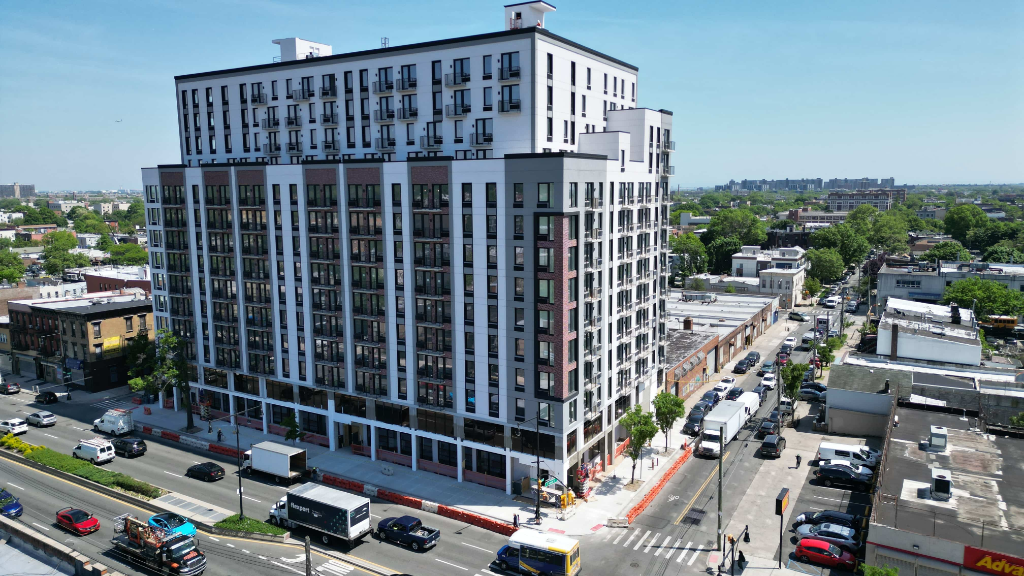
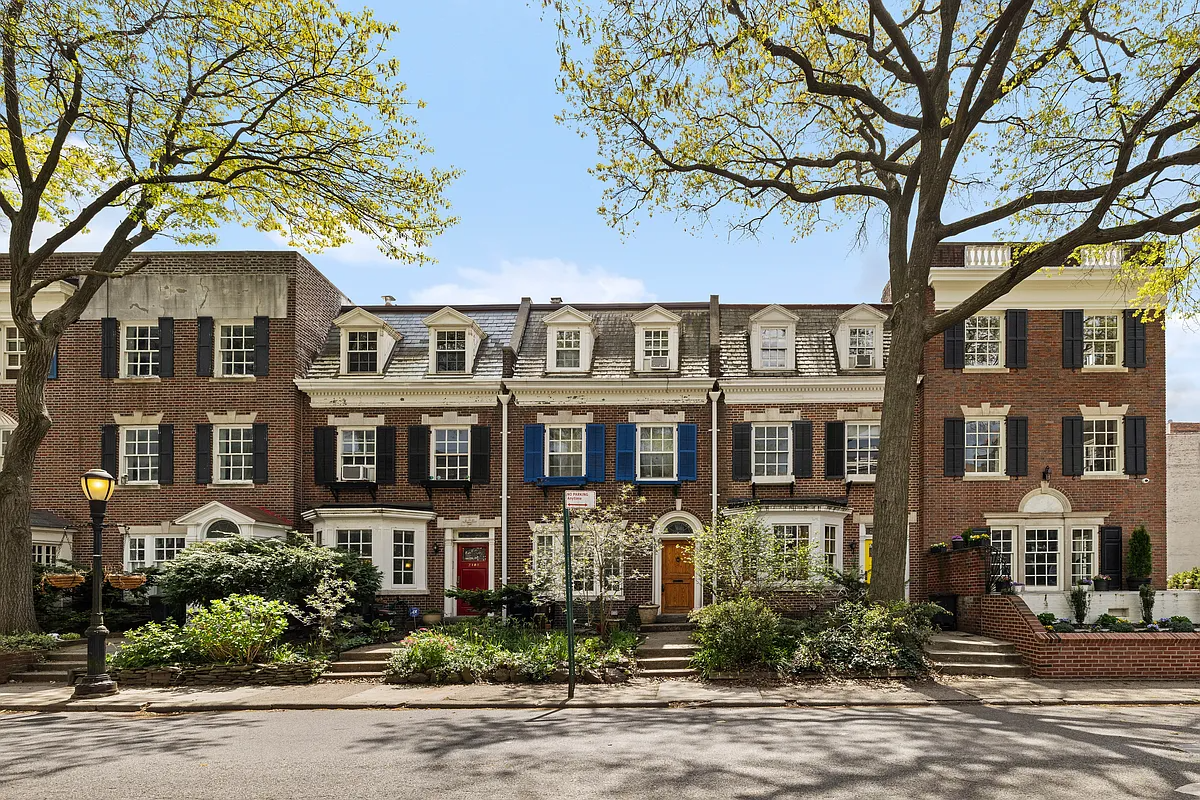
The Corcoran Group released its year-end market data today, and the brokerage’s stats show the ’07 Brooklyn market making healthy (if not huge) gains over 2006. The median sales price on all condos and co-ops was up 7 percent last year, to $590,000, while median townhouse values rose 2 percent in ’07, to $1.2 million. The really fun part of the report, however, is its breakdown of how various neighborhoods have fared, sales- and price-wise (see chart on jump). The big winner? Brooklyn Heights, where the median price shot up 19 percent, to $1.3 million. Cobble Hill/Carroll Gardens, on the other hand, showed a median price decrease of 9 percent, going from $950,000 in 2006 to $860,000 in 2007. And Park Slope’s median price slipped from $999,000 in ’06 to $928,000 in ’07. We have a few reservations about this report, including that it doesn’t specify the total number of sales it tracks, that it only compares year-over-year values, and that it basically only covers the priciest brownstone neighborhoods—though we have to give it up for the big C for devoting so much ink to Brooklyn sales data. The article in the Times this morning about the record-setting fourth-quarter Manhattan market notes that Brooklyn’s gains were more “stable” than Manhattan’s. Brooklyn showed its maturity this year because the appreciation was much more steady, said Corcoran Group president Pamela Liebman. Anyhow, do these numbers jibe with pricing trends you’ve noticed over the past year?
Apartment Prices in Manhattan Defy National Real Estate Slide [NY Times]
Photo by threecee.


sorry, 3:27. you are way off…
From the FED….not FOX NEWS:
Of the households that did carry a balance, the median amount owed was $1,900. That means half of the households with a balance owed more, and half owed less. (Medians are less subject to the skewing phenomenon that plagues averages; thats why economists tend to favor them.)
Bill Whitt at the VIP Forum, a Washington D.C. research firm, helped me dig even deeper. By analyzing the credit card debts of all the households the Fed surveyed, Whitt discovered:
Only 29% of households owe $1,000 or more on their cards.
21% owe $2,000 or more.
6% owe $8,000 or more.
4% owe $10,500 or more.
1% owe $21,400 or more.
The Fed statistics pretty much gibe with what Fair Isaac, the creator of the FICO credit score, discovered when it reviewed millions of credit reports.
The True Cost of Debt in America
In Debt We Trust Facts Sheet
* Total number of Americans: 300,000,000
* Total consumer debt of Americans: $3,000,000,000,000
* Average debt per U.S. household: $30,000
* Number of households not paying off their credit card balances each month: 6 in 10
* Average length of time, in months, spent paying off credit card debt: 43
* Consumer bankruptcies in 1980: 287,463
* Consumer bankruptcies in 2004: 1,500,000
* Percent increase in bankruptcies: 422
* Amount the average college student owes in loans by graduation: $30,000
* Amount that same student owes in additional consumer debt: $20,000
* Amount $1 invested in stocks in 1963 would have compounded to today: $12.36
* Amount $1 invested in real estate in 1963 would have compounded to today: $1.79
* Total in 2005 and 2006 lenders wrote in new home mortgages: $3,200,000,000,000
* Net profit percentage annually by the major credit card companies: 54
Lou since you seem to be focused on investment properties – please explain why I would want to invest in RE (as a class) with a cap rate of 6% (equal to or less then the cost of borrowed money-so no leverage) when with ZERO effort and ZERO risk I can earn greater than 5% in a Money Market account?
Sure there are certain undermarket properties in certain areas that one could expect income to increase enough to justify a purchase (got to love rent controls) but overall what could possibly justify buying into such a speculative market.
Yeah but Lou you are being VERY VERY naive if you think current Cap Rates are the historical norm. Besides Cap Rates have no bearing on individual housing unit prices.
Lou – not withstanding the relative lack of pure speculators (i.e. speculation without occupancy) the same speculative attitude (i.e. it doesn’t matter what I pay since it can only go up) is present here in NYC; In fact you are the embodiment of that.
Yet you ignore the relationship between income and value that you so clearly acknowledge in earlier posts.
At some point if personal income doesn’t grow to support prices then the speculative attitude will be destroyed (i.e. people will figure out RE can decline in value) and then the whole dynamic changes.
In NYC we can only count on foreign investment for so long (usually a sign of a market peak BTW) – eventually incomes and housing prices must return to a sustainable equilibrium – and the current layoffs and bonus pools on Wall Street seem to portend income actually going the wrong way – putting even more pressure on prices.
True, all but the French maybe. But if the currency values was reveresed, I would not think we would see this level of invenstment.
Plemicist – I don’t have a day job and when I did, I worked for the major investment banks including Credit Suiss First Boston, Bear Sterns, JP Morgan, etc. But that doesn’t matter.
First of all, the CAP RATE and the Yield on a Bond are very similiar.
This is not the forum to discuss it. You are very naive as an investor if you think that the Yield does not change over time. Are you forgetting that while a Bond’s initial Yield stays the same because the FACE VALUE of the bond stays the same, the Yield changes when the Bond is sold in the Bond Auction?
For instance, a $100 Face Value Bond has an inital Yield of 5%. That means it pays out $5 per year. Once the Bond is sold at a different price, say $110, it’s new Yield is calculated as $5/$110 = 4.5% Current Yield.
The same for Real Estate. The Cap Rate is fixed in the beginning. So if the NOI is $50,000 per year and the price was $500,000.. the CAP RATE is 10%. BUT… if the NOI changes to $100k, the Cap Rate can be calculated again at $100k/$500k = 20%. BUT it is better to instead arrive at a price based on Current Cap Rate. So, if the CAP RATE for the neighborhood remained the same, which is 10%, then you have to solve for the equation, 10% CAP = $100k/Price
The Price must now be $1 Million. Same as the bond but done in a different way.
The other problem with your comments is that investors care about the Future Cashflows…. not the return on their equity. That’s a very naive way of thinking. I’m not here to teach you, but please try to understand that when you buy a business, and thinking of Real Estate’s future value is thinking of Real Estate as a Business, you are buying all of it’s future Cashflows. That includes the last cashflow which is made by the sales proceeds once you sell it.
Sorry Polemicist. If you can’t follow the argument, don’t be condescending to me (“Stick to whatever your day job is.”)
Keep your condescending attitude to yourself please.
If you want to talk about Theories of Real Estate Investing, then don’t be condescending to me or anyone else on this board. You are starting to sound like “The What” carbon copy.
Investor Lou
I think the Europeans just love New York City.
Just like a lot of us love their respective countries.
If I had the dough, I’d buy a place in Berlin or Paris or London or Barcelona.
Most New Yorkers would rather go 6 hours by plane there than go to Florida or Arizona or Vegas.
Are the European investors betting on real estate prices or currency fluctuations?