
215 Gates Sells...For the Fifth Time in Five Years
The wreck of a brownstone at 215 Gates Avenue in Bed Stuy finally sold earlier this month for $440,000, bringing, perhaps, an end to a five-year roller coaster ride that’s emblematic of the boom-bust cycle of the housing boom and its excesses and abuses. Here’s the sales data from PropertyShark: June 2004: $655,000 March 2006:…

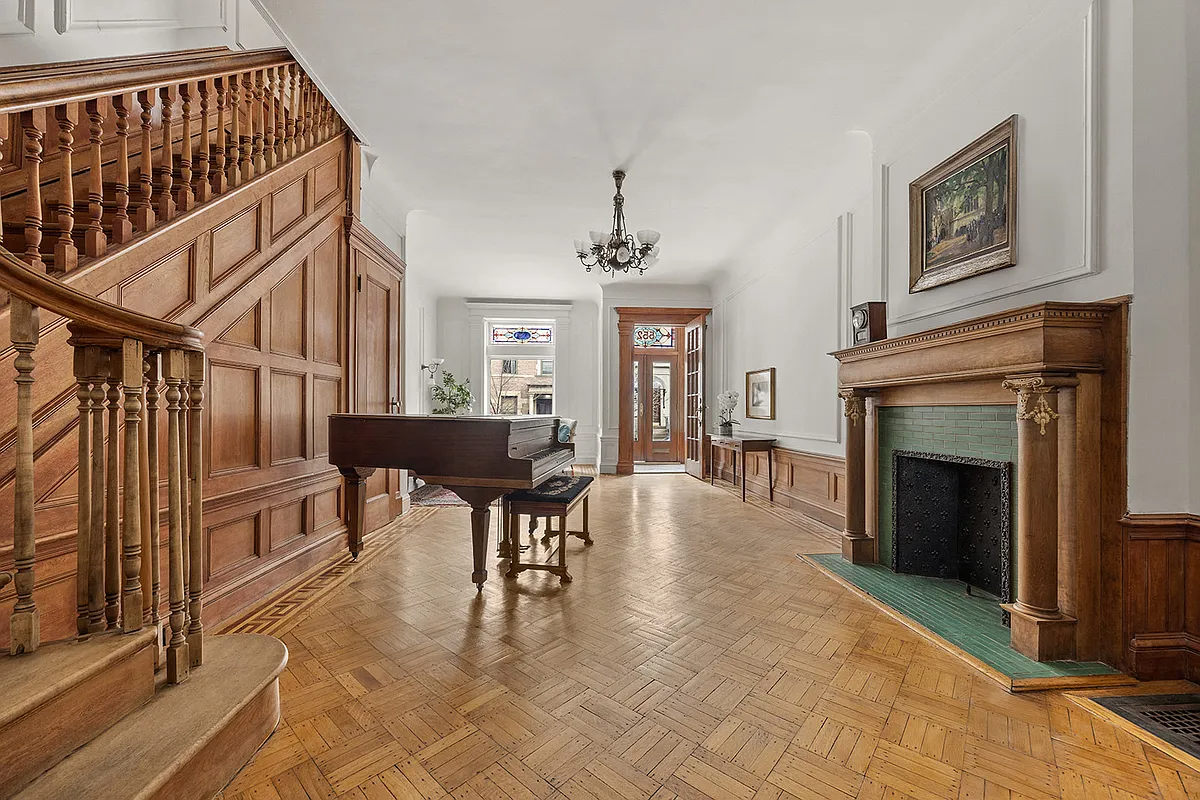
The wreck of a brownstone at 215 Gates Avenue in Bed Stuy finally sold earlier this month for $440,000, bringing, perhaps, an end to a five-year roller coaster ride that’s emblematic of the boom-bust cycle of the housing boom and its excesses and abuses. Here’s the sales data from PropertyShark:
June 2004: $655,000
March 2006: $902,000
August 2008: $776,546
October 2008: $325,000
June 2009: $440,000
If that $902,000 number for a wreck of a brownstone looks suspicious to you, then you’ll also be interested by the fact that the buyer was able to finance 100 percent of the purchase. The only comforting thing about all this data is that it suggests that the Bed Stuy market is up 35 percent since last summer. Good to know.
House of the Day: 215 Gates Avenue [Brownstoner]
215 Gates Avenue [Historic Brooklyn] GMAP P*Shark


Guys,
The whole damn housing bubble was fraud. This case represents the whole enchilada.
***Bid half off peak comps***
“What makes you say we are a cheerleader?”
Your HOTD opinions about asks. Subtle but relatively cheery and rosy. You might say things are overpriced but never by much. At least not in the so-called prime areas which I believe will take a bath like everywhere else.
***Bid half off peak comps***
It’s Case-Killa Tuesday.
NY S&P Case-Shiller Home Price Index (Excludes condos, coops, 2+ fams, new construction and includes the whole Tri-state. However, up 200% peak/trough just like brownstones. Relevant on the way up, relevant on the way down. There’s only one housing market for which everything is proprotional.):
Columns: DATE, READING, CHANGE FROM PEAK, CHANGE FROM SAME MONTH LAST YEAR (YOY)
Jun-06 215.83 (PEAK)
Jul-06 215.25 -0.27% 7.70%
Aug-06 214.34 -0.69% 5.94%
Sep-06 214.08 -0.81% 4.52%
Oct-06 214.28 -0.72% 3.20%
Nov-06 214.23 -0.74% 1.87%
Dec-06 213.79 -0.95% 0.52%
Jan-07 212.78 -1.41% -0.34%
Feb-07 212.52 -1.53% -0.91%
Mar-07 212.39 -1.59% -0.91%
Apr-07 211.61 -1.96% -1.56%
May-07 210.51 -2.46% -2.35%
Jun-07 209.49 -2.94% -2.94%
Jul-07 208.36 -3.46% -3.20%
Aug-07 207.15 -4.02% -3.35%
Sep-07 206.35 -4.39% -3.61%
Oct-07 205.54 -4.77% -4.08%
Nov-07 204.58 -5.21% -4.50%
Dec-07 202.47 -6.19% -5.29%
Jan-08 200.78 -6.97% -5.64%
Feb-08 198.45 -8.05% -6.62%
Mar-08 196.53 -8.94% -7.47%
Apr-08 194.78 -9.75% -7.95%
May-08 193.88 -10.17% -7.90%
Jun-08 194.22 -10.01% -7.29%
Jul-08 193.64 -10.28% -7.06%
Aug-08 193.33 -10.42% -6.67%
Sep-08 191.32 -11.36% -7.28%
Oct-08 189.79 -12.07% -7.66%
Nov-08 186.81 -13.45% -8.69%
Dec-08 183.5 -14.98% -9.37%
Jan-09 181.00 -15.91% -9.85%
Feb-09 178.16 -16.88% -10.22%
Mar-09 173.22 -19.09% -11.86%
Apr-09 170.33 -20.51% -12.55% ***f”($) < 0***
When will YOY approach zero? Where are we today (there’s a two month lag)?
***Bid half off peak comps***
I bid $220.
We agree totally with all of the above explanations but decided it was wiser to let the facts speak for themselves on this one, hence our inclusion of the financing info…
this sound more like example of mortgage fraud and scam than legit sales.
What makes you say we are a cheerleader? Believing in the long-term attractiveness of the FG/CH/BS corridor is one thing but when have we said that prices are heading north anytime soon or that this is a great time to buy?
Look, DIBS! 325 to 440. We have recovery!
“excesses and abuses”
Whoah, ‘stoner. Pretty strong words for a cheerleader (formerly?).
***Bid half off peak comps***
It’s called sarcasm, What. You’re right that this is a disaster when some dopey appraiser lines it up against a house a few blocks away. Luckily this place hadn’t hit the tape yet when our appraisal was done last month!