
Brooklyn Sees Most Housing Development in NYC in Past 13 Years, Data Shows
A city report with new visualizations shows housing development is concentrated in expensive, dense areas of Brooklyn.

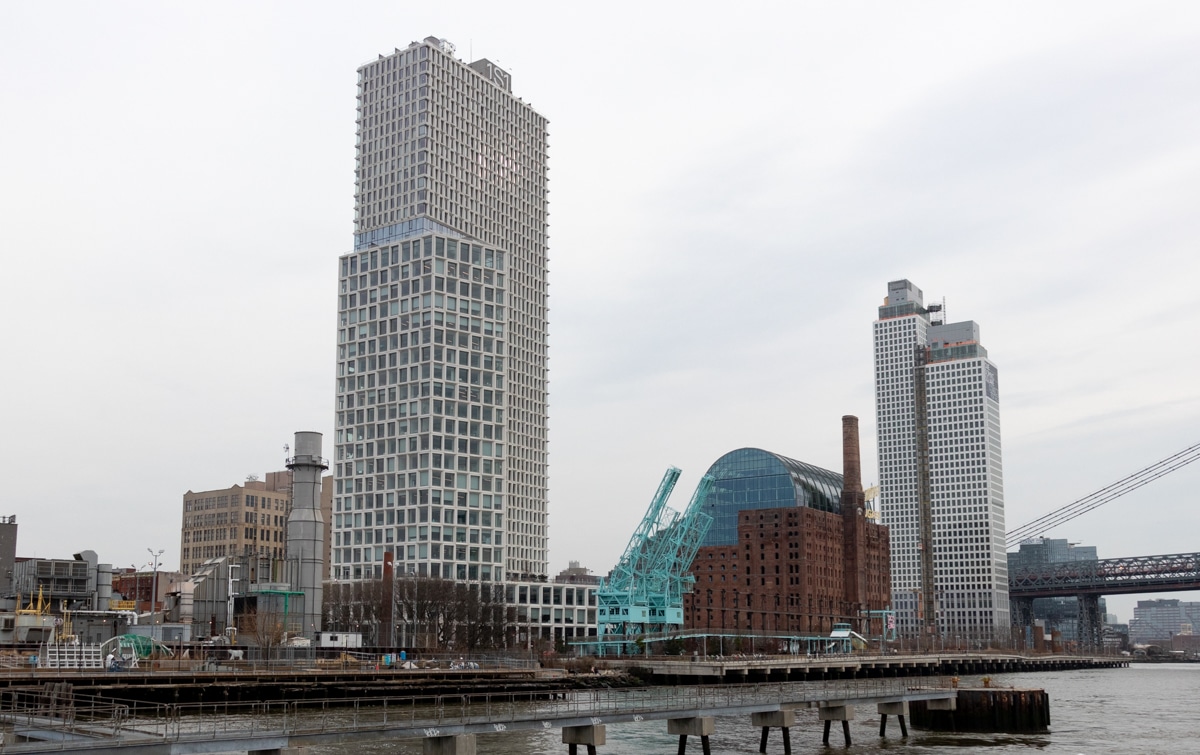
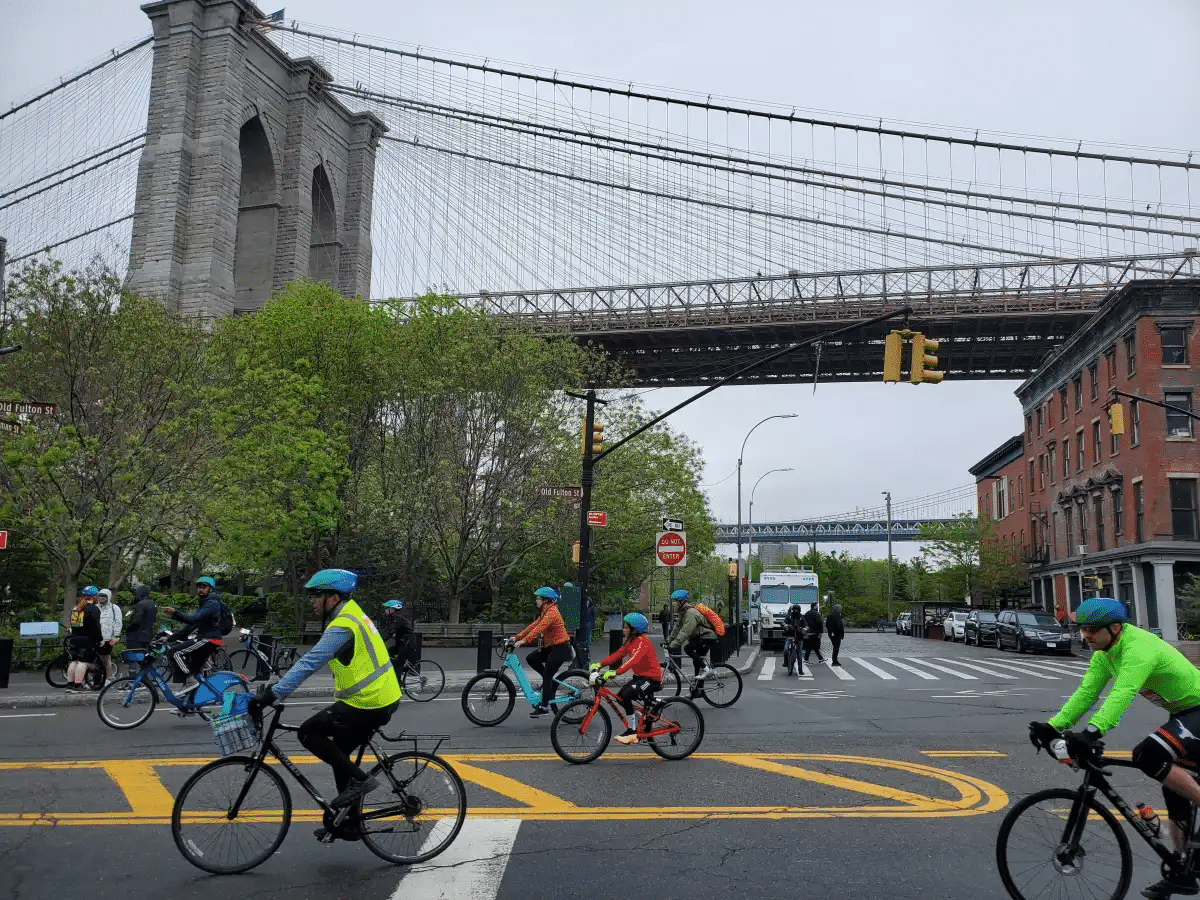
Fort Greene and Downtown Brooklyn. Photo by Susan De Vries
The majority of the city’s housing development over the past 13 years has been in north and northwest Brooklyn, visualizations released by the city Thursday show. And while development citywide has been substantial during that timeframe, with more than 297,500 new housing units constructed, the data also reflect slowdowns during periods when the city’s 421-a tax abatement program expired.
The Department of City Planning updated its housing database with data from 2023 and, in tandem, released the two new visualizations tracking how much housing is created in the city and where.
The database shows that since 2010, Brooklyn has gained 133,961 housing units in new construction, almost twice as many as the borough with the second highest level of development, Queens, where 78,161 homes have been built. In Brooklyn, Community Board 1 and CB2 — both areas with some of the highest housing costs in the borough — have seen the most growth.
In Community Board 1, which encompasses Williamsburg and Greenpoint, 26,253 new units have gone up between 2010 and 2023. These include apartments at the multi-tower complex Greenpoint Landing and at Domino on formerly industrial land along the waterfront in Greenpoint and Williamsburg. Community Board 2, which includes Downtown Brooklyn, Boerum Hill, Brooklyn Heights, Fulton Ferry, Dumbo, Vinegar Hill, Fort Greene, and Clinton Hill (as well as the nonresidential Brooklyn Navy Yard), has seen 21,431 new homes built.
In addition to the new builds, Brooklyn has also seen 78,161 new housing units developed through alteration or adaptive reuse projects, the data show.
Areas in southern Brooklyn, among the least dense and most affordable in the borough, have experienced the least amount of new-housing construction in the same period. Consistently, Community Board 18, which includes Amersfort, Bergen Beach, Canarsie, Flatbush, Flatlands, Fraser, Georgetowne, Marine Park, Mill Basin, and Mill Island, and Community Board 10, which includes Bay Ridge, Dyker Heights, and Fort Hamilton, have had the least development in Brooklyn. CB18 saw just 580 new units developed in 13 years, and CB10 was even lower at 532.
The report is compiled by the city’s Department of City Planning, and contains all housing construction and demolition permits approved by the Department of Buildings since 2010. The three permit types it tracks are new buildings, major alterations, and demolitions.
The data also reflect slowdowns in both construction and permitting occurring in line with periods when the state’s 421-a tax abatement program expired. A new version of the tax abatement, called 485x, was approved last week by the state legislature. The abatements give developers a property tax break in exchange for including a percentage of income-restricted and rent-stabilized units in their developments.
Before the program’s most recent expiration expiration in 2022, Brooklyn in 2021 saw 11,471 new units built and 8,758 new building application permits filed. In 2023, that number dropped in both categories to 9,271 new units built and 5,285 new building application permits filed.
For the first time in the 13 year span, Brooklyn was outpaced in 2023 in new housing development, with the Bronx clocking in at 9,842 new units and Brooklyn trailing at 9,271. Nonetheless, the borough still tracked thousands more new units built in 2023 than 10 years ago, when in 2013, 4,562 new units were built.
But with or without the tax break, it isn’t clear that simply building more market-rate units will serve the low- and middle-income New Yorkers desperately in need of affordable housing. While the city now has more units of housing per person than ever, this year’s vacancy rate for apartments costing less than $2,400 a month dropped to below 1 percent.
Regardless, development doesn’t look to be slowing down. According to the data, as of December 2023 there were active permits to build 45,148 new housing units in Brooklyn, again almost twice as much as the Queens, which has the next highest number at 23,677.
Related Stories
- How Much Housing Will Hochul’s New Deal Build?
- State Workaround for Expired Tax Break Will Let Thousands of Pricey Units Proceed in Gowanus
- Pols, Advocates Wrangle Over Future of 421-a Tax Break for Development, ‘Affordable’ Housing
Email tips@brownstoner.com with further comments, questions or tips. Follow Brownstoner on Twitter and Instagram, and like us on Facebook.


What's Your Take? Leave a Comment