The McGraw-Hill Companies Feedback | United States [change] | Register | Login Home Ratings Indices Products & Services About S&P
Select Country or Region x
Americas
United States
Canada
Latin America (English)
Latin America (Spanish)
Latin America (Portuguese)
S&P Affiliates
India – Crisil
Taiwan Ratings Asia
Australia
New Zealand
China
Japan
Korea
Asia (English)
Europe & MiddleEast
Europe
Gulf Cooperation Council (GCC)
Russia
Search By: Entity Ticker CUSIP CINS ISIN
The Shadow Inventory Of Troubled Mortgages Could Undo U.S. Housing Price GainsPublication date: 16-Feb-2010 10:48:43 EST
——————————————————————————–
View Analyst Contact InformationTable of Contents
MethodologyA Swelling Number Of Distressed Loans Creates The Shadow InventoryRecently Cured Loans Amplify The InventoryThe Shadow Inventory Will Need To ClearServicers’ Shifts In StrategyLiquidations Lead To Lower Housing PricesThe Rate Of Liquidations Is Likely To IncreaseThe Supply Of Homes On The Market Is Likely To Grow
In summer 2009, the seasonally adjusted S&P/Case-Shiller Home Price Index rose for the first time in virtually two years. Since May 2009, the index has risen by over 3%, suggesting that the necessary correction to U.S. residential home prices is nearing an end. However, in Standard & Poor’s Ratings Services’ view, the mortgage crisis may be far from over. The overhang of homes heading toward liquidation suggests more delinquencies and lower home prices are to come.
The current “shadow inventory” (including all delinquent loans, not only those that are real estate owned [REO]) of troubled mortgages will likely take about 33 months?or nearly three years?to clear at the current rate of liquidations. Moreover, we believe this estimate is conservative, as we do not assume any loans that have yet to show any serious signs of distress to date will default in the future and further increase the overhang of homes. Nonetheless, we believe that in reality additional loans will default in the near future due to the weak economic environment, distressed residential home values, and the resulting contraction in the supply of mortgage finance.
We believe that the recent reversal in housing prices is the result of a temporary constriction in the supply of foreclosed homes on the market. This temporary constriction ensued because servicers have completed fewer foreclosures due to court delays, servicing backlogs, and political pressure to keep borrowers in their homes. However, there is a rapidly growing shadow inventory of properties where borrowers are delinquent but foreclosure has not been completed. Overall, it is our opinion that recent positive housing reports should not be construed as a sign that the distress in the residential housing market is abating, but rather should be attributed to the temporarily limited supply of homes on the market.
Methodology
We included in our analysis all first-lien prime, Alternative-A, and subprime mortgages for single-family, two to four family, coops/condos, and manufactured houses that appear in private, nonagency securitized transactions. While the sample was not limited by vintage, we focused our attention on trends occurring since 2005. We did not only consider transactions that Standard & Poor’s rates. Rather, we incorporated all the securitized loan-level data available through LoanPerformance, a unit of First American CoreLogic, which provides residential-mortgage backed securities data.
Throughout our analysis, we chose to use the original balance instead of the current balance of each loan because we wanted a consistent balance for comparison over the loan’s life. Our analysis does not consider loss severity in the event of default, only the frequency of default.
We classified all loans into one of four different categories (see table) in order to assess the relative size of the overhang, or shadow inventory, problem. The four categories were performing, recently cured, seriously delinquent, and REO. We aggregated the data according to these classifications over time to determine the relative size of the trends (see chart 1).
Standard & Poor’s Loan Classifications Based On Performance
Category Current delinquency status 90+ days delinquent within previous 12 months?
Performing Less than 90 days delinquent No
Recently Cured Less than 90 days delinquent Yes
Seriously Delinquent 90+ days delinquent or in foreclosure N/A
REO* Real estate owned N/A
*REO loans represent homes in foreclosure, with ownership transferred from the borrower to the lender or securitization trust. N/A–Not applicable.
Chart 1
A Swelling Number Of Distressed Loans Creates The Shadow Inventory
The monthly balance of distressed loans currently outstanding relative to the monthly balance of those that pay off, or close, suggests that there is a growing shadow inventory of loans that need to undergo the closure process. In January 2005, the balance of distressed loans outstanding was about 18x that of distressed loans that closed. Today, the balance of outstanding to closed distressed loans has increased to about 31x (see chart 2).
Chart 2
We broadly attribute the increasing shadow inventory of outstanding distressed loans to the fact that loans are becoming distressed at a faster pace than they are closing. However, while the balance of outstanding distressed loans has increased since 2005, not all of the components of distressed loans have similarly increased. Chart 3 displays the balance of distressed loans broken down into its components: REO and seriously delinquent loans. The balance of seriously delinquent loans has continuously grown since 2005, while the balance of REO loans appears to have peaked toward the end of 2008 and has since steadily declined.
The typical path of a seriously delinquent loan involves a transition from its current state to REO and subsequently to liquidation. In our opinion, the demonstrated growing shadow inventory may be a result of delays that seriously delinquent loans are experiencing in their transition to REO.
Chart 3
Given the typical path of a seriously delinquent loan, we expect the balance of REO loans to change at a rate consistent with that of the balance of seriously delinquent loans. Chart 4 displays the consistent monthly increase in the balance of seriously delinquent loans since July 2006. The number of loans that joined the REO category, on the other hand, has significantly declined since fall 2008 (see chart 5). It appears that loans are becoming seriously delinquent, but are not becoming REO at anywhere near the same rate (see chart 6). Instead, they are swelling the ranks of seriously delinquent loans–forming
I know it will sound like sacrilege but I don’t find Pateks particularly beautiful- certainly not like the watches CGar and I want. But if it came down to the Patek or the HOTD- I’ll also take the watch.
DH, one of only 225 (or summin like that) of the first Superman comic book went for $1 million yesterday. I’d take the watch – over the comic book AND today’s HOTD.


See the rest here…
http://tinyurl.com/ybbl7wz
***Bid half off peak comps***
The McGraw-Hill Companies Feedback | United States [change] | Register | Login Home Ratings Indices Products & Services About S&P
Select Country or Region x
Americas
United States
Canada
Latin America (English)
Latin America (Spanish)
Latin America (Portuguese)
S&P Affiliates
India – Crisil
Taiwan Ratings Asia
Australia
New Zealand
China
Japan
Korea
Asia (English)
Europe & MiddleEast
Europe
Gulf Cooperation Council (GCC)
Russia
Search By: Entity Ticker CUSIP CINS ISIN
The Shadow Inventory Of Troubled Mortgages Could Undo U.S. Housing Price GainsPublication date: 16-Feb-2010 10:48:43 EST
——————————————————————————–
View Analyst Contact InformationTable of Contents
MethodologyA Swelling Number Of Distressed Loans Creates The Shadow InventoryRecently Cured Loans Amplify The InventoryThe Shadow Inventory Will Need To ClearServicers’ Shifts In StrategyLiquidations Lead To Lower Housing PricesThe Rate Of Liquidations Is Likely To IncreaseThe Supply Of Homes On The Market Is Likely To Grow
In summer 2009, the seasonally adjusted S&P/Case-Shiller Home Price Index rose for the first time in virtually two years. Since May 2009, the index has risen by over 3%, suggesting that the necessary correction to U.S. residential home prices is nearing an end. However, in Standard & Poor’s Ratings Services’ view, the mortgage crisis may be far from over. The overhang of homes heading toward liquidation suggests more delinquencies and lower home prices are to come.
The current “shadow inventory” (including all delinquent loans, not only those that are real estate owned [REO]) of troubled mortgages will likely take about 33 months?or nearly three years?to clear at the current rate of liquidations. Moreover, we believe this estimate is conservative, as we do not assume any loans that have yet to show any serious signs of distress to date will default in the future and further increase the overhang of homes. Nonetheless, we believe that in reality additional loans will default in the near future due to the weak economic environment, distressed residential home values, and the resulting contraction in the supply of mortgage finance.
We believe that the recent reversal in housing prices is the result of a temporary constriction in the supply of foreclosed homes on the market. This temporary constriction ensued because servicers have completed fewer foreclosures due to court delays, servicing backlogs, and political pressure to keep borrowers in their homes. However, there is a rapidly growing shadow inventory of properties where borrowers are delinquent but foreclosure has not been completed. Overall, it is our opinion that recent positive housing reports should not be construed as a sign that the distress in the residential housing market is abating, but rather should be attributed to the temporarily limited supply of homes on the market.
Methodology
We included in our analysis all first-lien prime, Alternative-A, and subprime mortgages for single-family, two to four family, coops/condos, and manufactured houses that appear in private, nonagency securitized transactions. While the sample was not limited by vintage, we focused our attention on trends occurring since 2005. We did not only consider transactions that Standard & Poor’s rates. Rather, we incorporated all the securitized loan-level data available through LoanPerformance, a unit of First American CoreLogic, which provides residential-mortgage backed securities data.
Throughout our analysis, we chose to use the original balance instead of the current balance of each loan because we wanted a consistent balance for comparison over the loan’s life. Our analysis does not consider loss severity in the event of default, only the frequency of default.
We classified all loans into one of four different categories (see table) in order to assess the relative size of the overhang, or shadow inventory, problem. The four categories were performing, recently cured, seriously delinquent, and REO. We aggregated the data according to these classifications over time to determine the relative size of the trends (see chart 1).
Standard & Poor’s Loan Classifications Based On Performance
Category Current delinquency status 90+ days delinquent within previous 12 months?
Performing Less than 90 days delinquent No
Recently Cured Less than 90 days delinquent Yes
Seriously Delinquent 90+ days delinquent or in foreclosure N/A
REO* Real estate owned N/A
*REO loans represent homes in foreclosure, with ownership transferred from the borrower to the lender or securitization trust. N/A–Not applicable.
Chart 1
A Swelling Number Of Distressed Loans Creates The Shadow Inventory
The monthly balance of distressed loans currently outstanding relative to the monthly balance of those that pay off, or close, suggests that there is a growing shadow inventory of loans that need to undergo the closure process. In January 2005, the balance of distressed loans outstanding was about 18x that of distressed loans that closed. Today, the balance of outstanding to closed distressed loans has increased to about 31x (see chart 2).
Chart 2
We broadly attribute the increasing shadow inventory of outstanding distressed loans to the fact that loans are becoming distressed at a faster pace than they are closing. However, while the balance of outstanding distressed loans has increased since 2005, not all of the components of distressed loans have similarly increased. Chart 3 displays the balance of distressed loans broken down into its components: REO and seriously delinquent loans. The balance of seriously delinquent loans has continuously grown since 2005, while the balance of REO loans appears to have peaked toward the end of 2008 and has since steadily declined.
The typical path of a seriously delinquent loan involves a transition from its current state to REO and subsequently to liquidation. In our opinion, the demonstrated growing shadow inventory may be a result of delays that seriously delinquent loans are experiencing in their transition to REO.
Chart 3
Given the typical path of a seriously delinquent loan, we expect the balance of REO loans to change at a rate consistent with that of the balance of seriously delinquent loans. Chart 4 displays the consistent monthly increase in the balance of seriously delinquent loans since July 2006. The number of loans that joined the REO category, on the other hand, has significantly declined since fall 2008 (see chart 5). It appears that loans are becoming seriously delinquent, but are not becoming REO at anywhere near the same rate (see chart 6). Instead, they are swelling the ranks of seriously delinquent loans–forming
haha bx – i’m with you on pateks not being very pretty.
haha – you like the vintage ones with period details!! shocker!!
alrighty – i’m really outta here. night
Of course, the Pateks I do like are in the museum! http://www.patekmuseum.com/
dayum – thats one ‘spensive comic!!
later y’all
I know it will sound like sacrilege but I don’t find Pateks particularly beautiful- certainly not like the watches CGar and I want. But if it came down to the Patek or the HOTD- I’ll also take the watch.
Thanks for watching my back, DH! (No homo)
bxgrl, supposed to be “every house”. ^^^
DH, one of only 225 (or summin like that) of the first Superman comic book went for $1 million yesterday. I’d take the watch – over the comic book AND today’s HOTD.
sorry – 1.3 million
same price as today’s HOTD – i’d take the watch
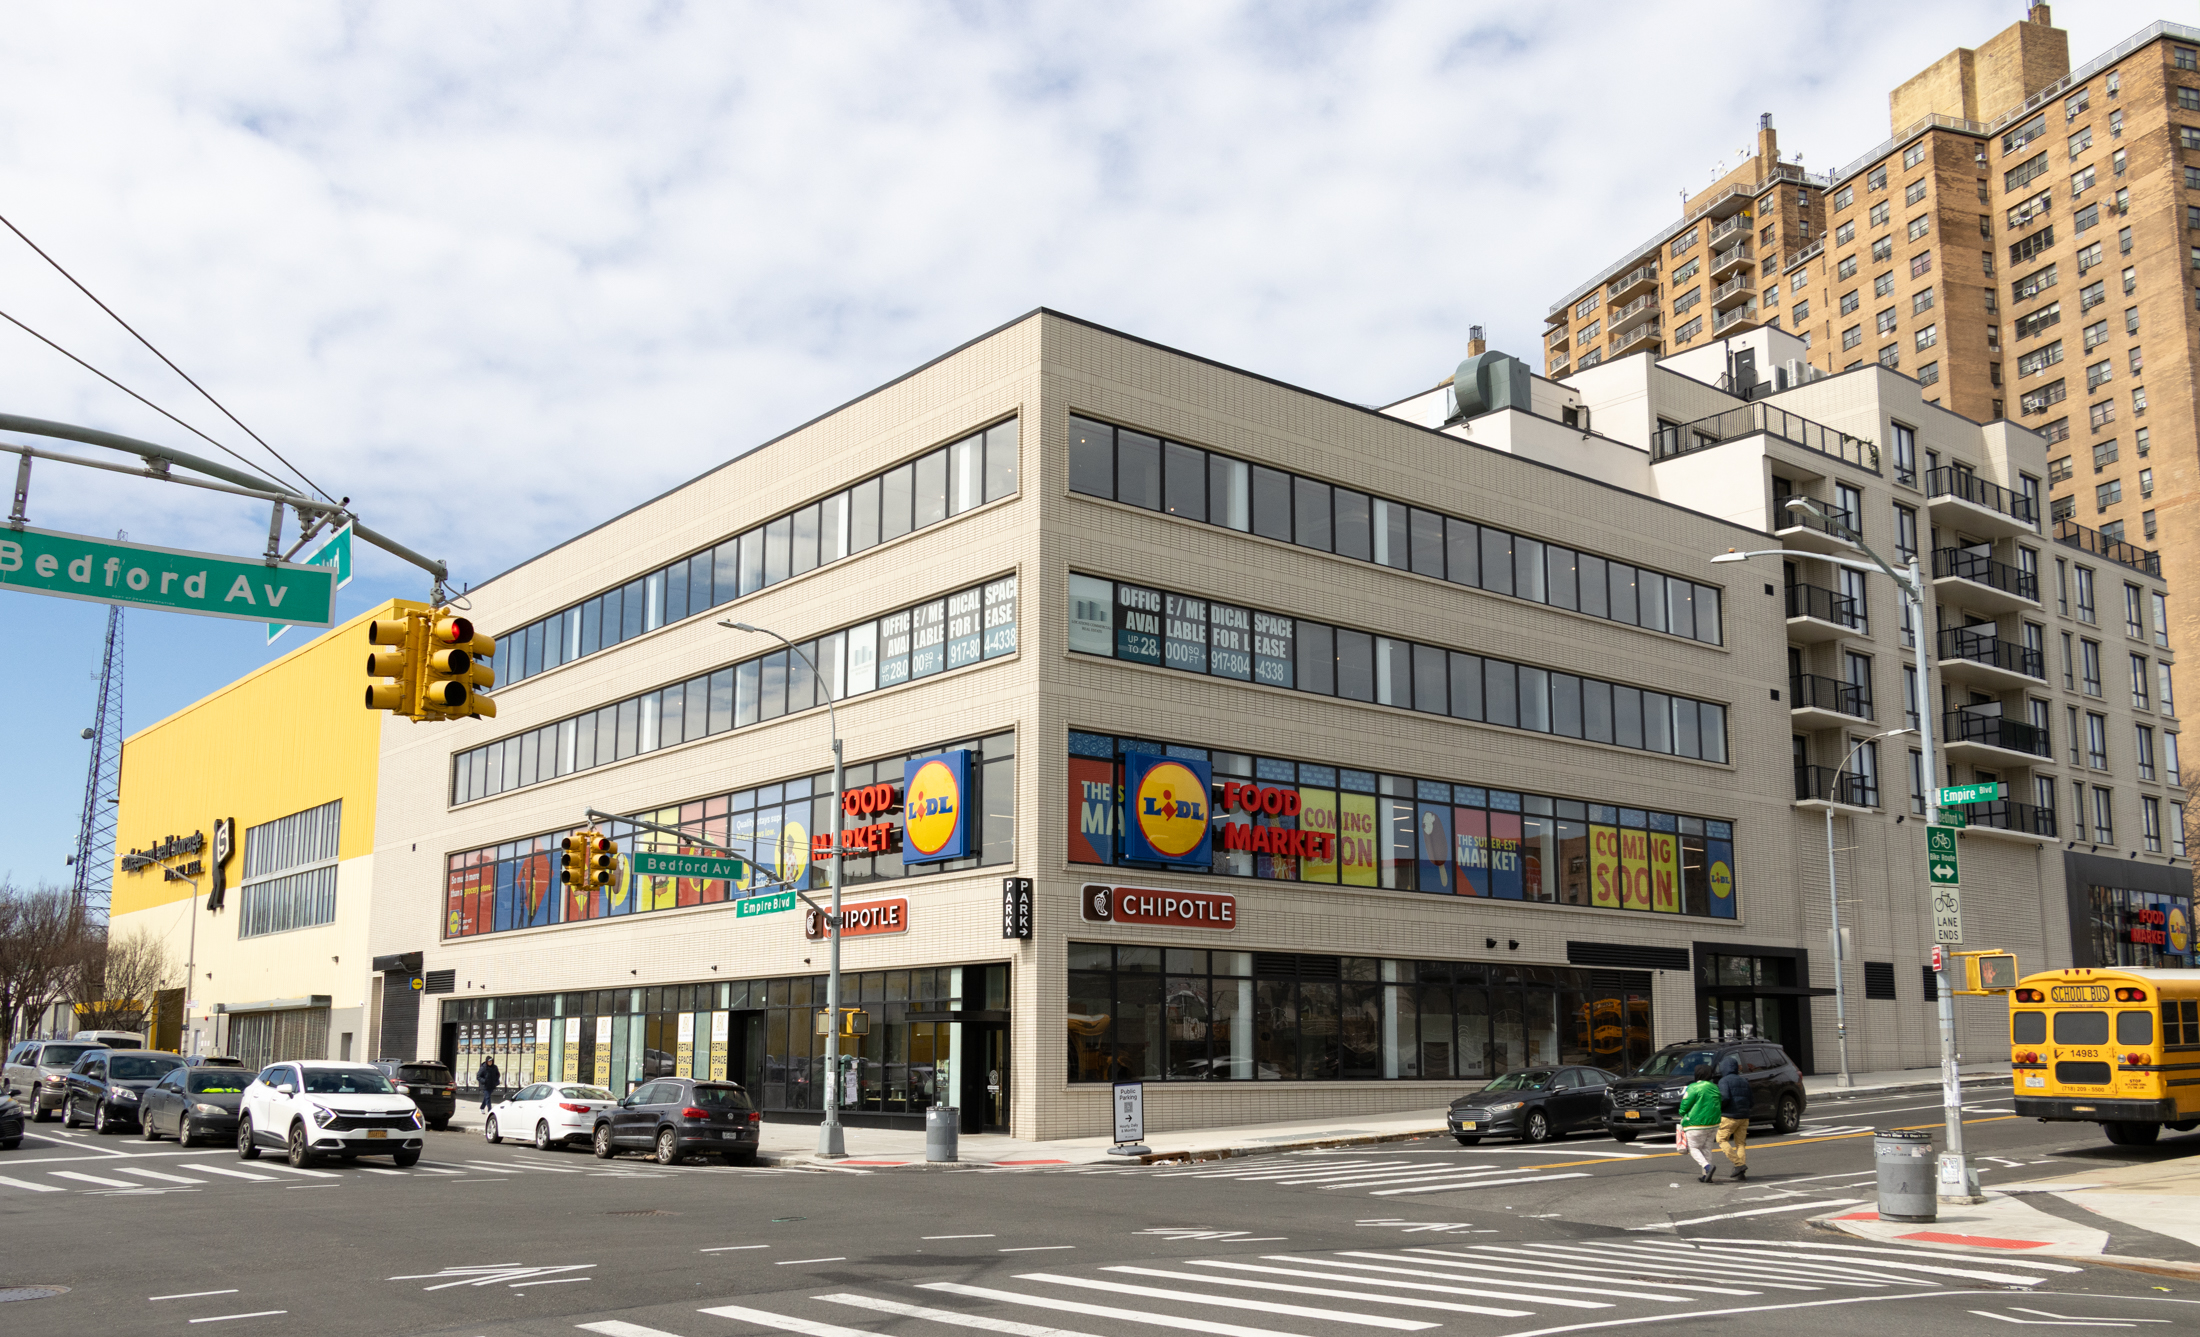
http://bk.ly/bA3
Million dollar patek phillipe watch – most complicated watch in the world.