
Tuesday Links
Photo by mgny903 from the Brownstoner Flickr pool. CBGB Remains in Industrial Storage Unit in Williamsburg [NY Times] Diabetes Deaths Soaring in Brooklyn [NY Daily News] Soup Kitchens Feeling the Pinch [NY Daily News] Murder in Boerum Hill [Brooklyn Eagle] Baby Makes Three at Atlantic Yards [Brooklyn Paper]

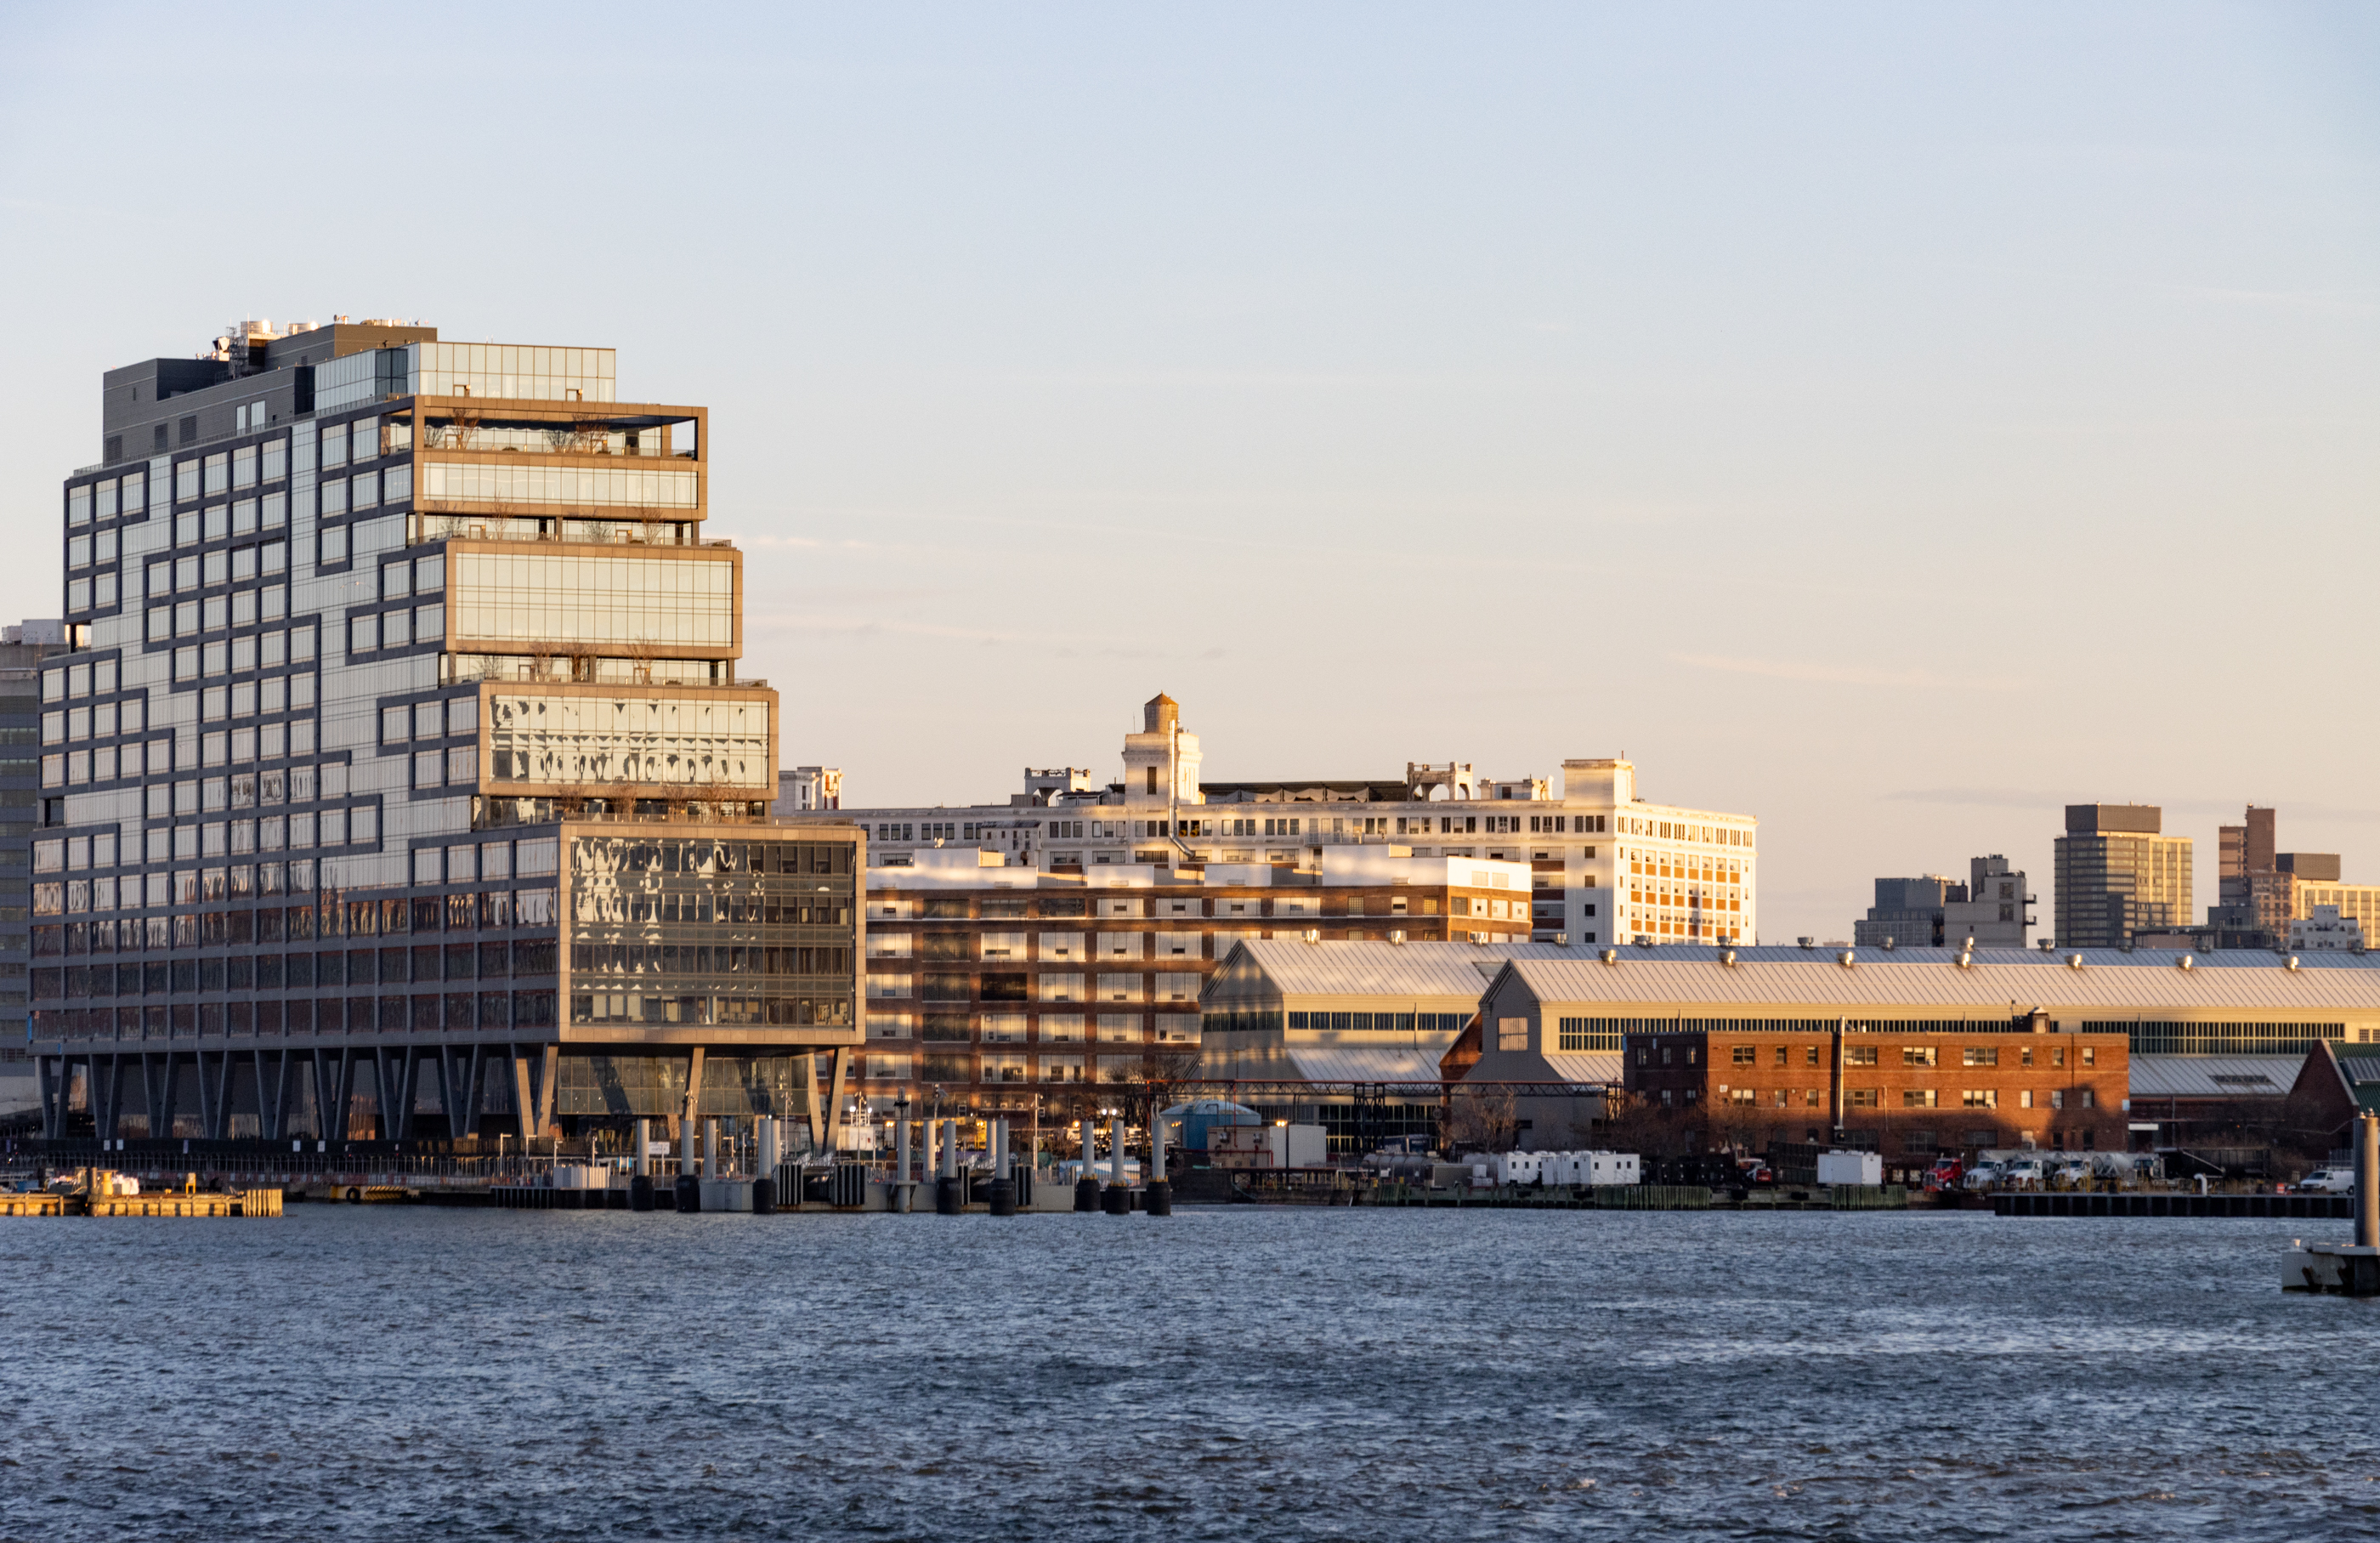
Photo by mgny903 from the Brownstoner Flickr pool.
CBGB Remains in Industrial Storage Unit in Williamsburg [NY Times]
Diabetes Deaths Soaring in Brooklyn [NY Daily News]
Soup Kitchens Feeling the Pinch [NY Daily News]
Murder in Boerum Hill [Brooklyn Eagle]
Baby Makes Three at Atlantic Yards [Brooklyn Paper]


Could someone explain the building in the background?
Looks like load bearing wall with sheets of plywood stapled to it?
Congratulations to Dan and Shabnam!
NYC Case Shiller Home Price Index
http://www.standardandpoors.com
MONTH/YEAR READING MOM YOY
June 2006 215.83 Peak 198.56% 9.13%
July 2006 215.25 -0.27% 7.70%
August 2006 214.34 -0.69% 5.94%
September 2006 214.08 -0.81% 4.52%
October 2006 214.28 -0.72% 3.20%
November 2006 214.23 -0.74% 1.87%
December 2006 213.79 -0.95% 0.52%
January 2007 212.78 -1.41% -0.34%
February 2007 212.52 -1.53% -0.91%
March 2007 212.39 -1.59% -0.91%
April 2007 211.61 -1.96% -1.56%
May 2007 210.51 -2.46% -2.35%
June 2007 209.49 -2.94% -2.94%
July 2007 208.36 -3.46% -3.20%
August 2007 207.15 -4.02% -3.35%
September 2007 206.35 -4.39% -3.61%
October 2007 205.54 -4.77% -4.08%
November 2007 204.58 -5.21% -4.50%
December 2007 202.47 -6.19% -5.29%
January 2008 200.78 -6.97% -5.64%
February 2008 198.45 -8.05% -6.62%
March 2008 196.53 -8.94% -7.47%
April 2008 194.78 -9.75% -7.95%
May 2008 193.88 -10.17% -7.90%
June 2008 194.22 -10.01% -7.29%
July 2008 193.64 -10.28% -7.06%
August 2008 193.33 -10.42% -6.67%
September 2008 191.32 -11.36% -7.28%
MOM = month over month (change from last month)
YOY = year over year (change from same month last year)
The YOY from May to August of this year showed signs of recovery. But even before October’s “crisis”, the YOY changed direction. The market will only stabilize (bottom) when the YOY approaches zero.
Re: Murder in Boerum Hill [Brooklyn Eagle]
Wyckoff Gardens? Must be sobering for those who recently purchased near those PJ’s.
can someone tell me where i can purchase that painting of the rottie on the lower right?! seriously.!
*rob*