
Mapping Traffic-Related Deaths
A reader tipped us off to this map, which shows road fatalities between 2001 and 2009. The Brooklyn view allows one to see the ages of people that died in traffic during that period.
A reader tipped us off to this map, which shows road fatalities between 2001 and 2009. The Brooklyn view allows one to see the ages of people that died in traffic during that period.
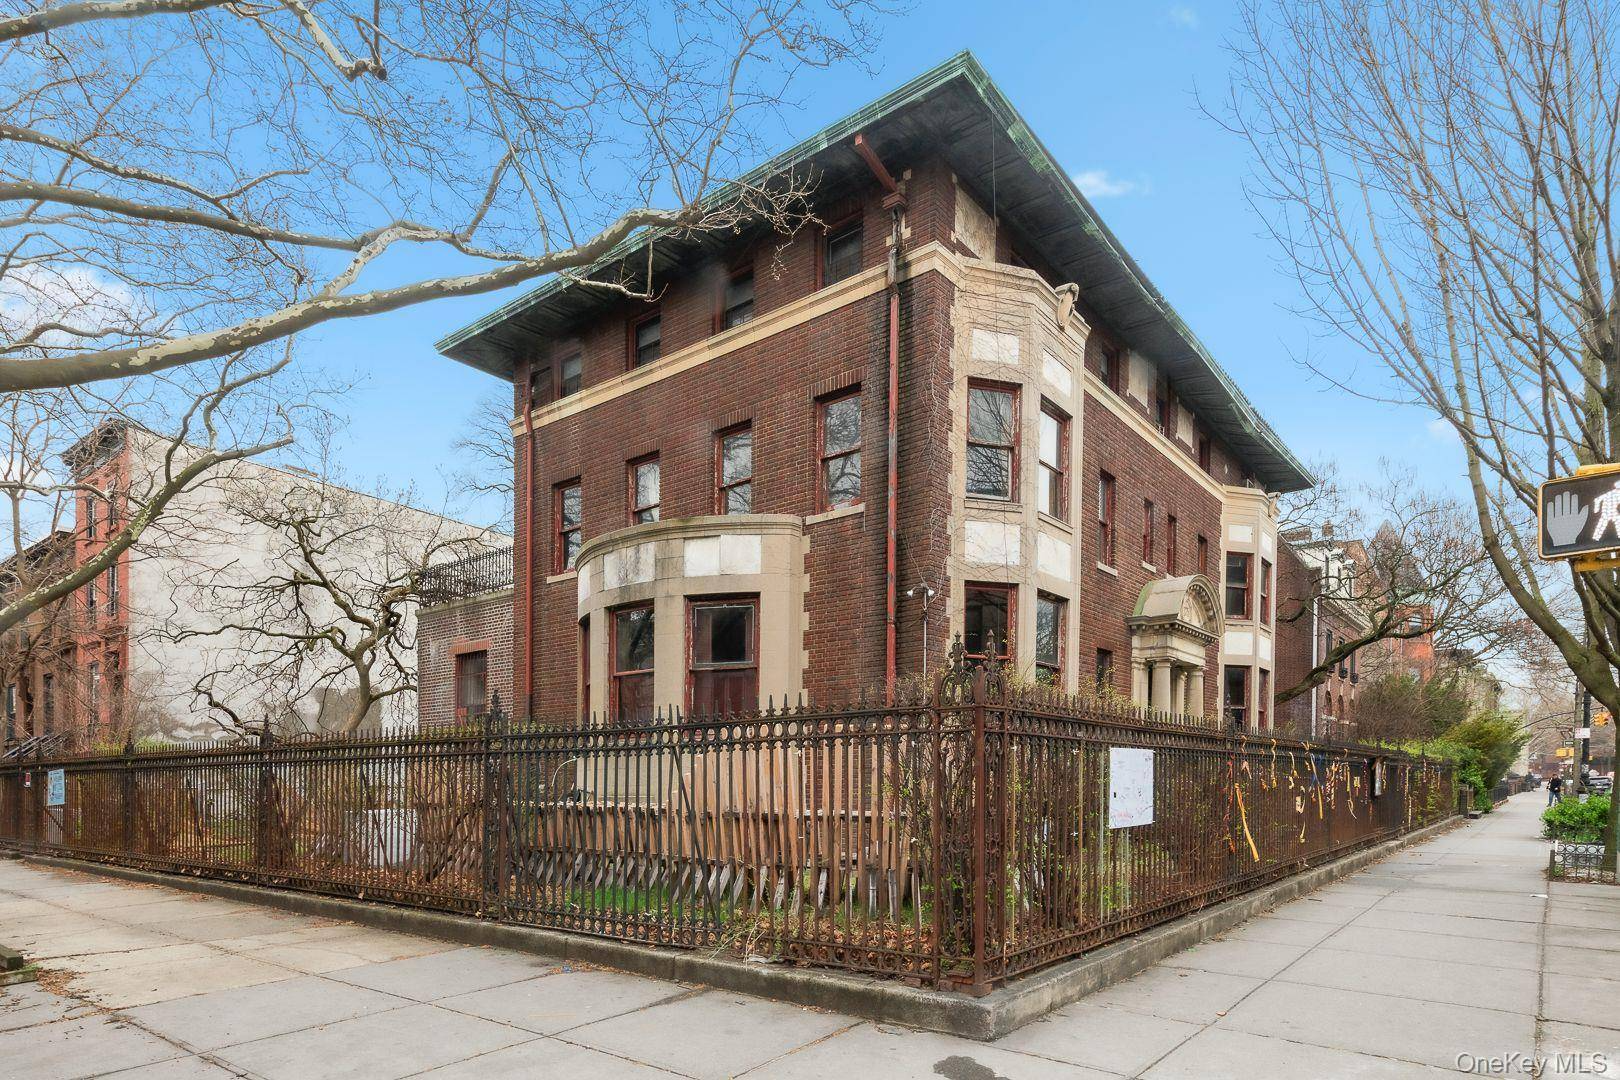

considering how crowded Brooklyn is, and how frantic and distracted most New Yorkers are most of the time, I am surprised that there are not many more traffic-related deaths.