
Looking for the Bottom
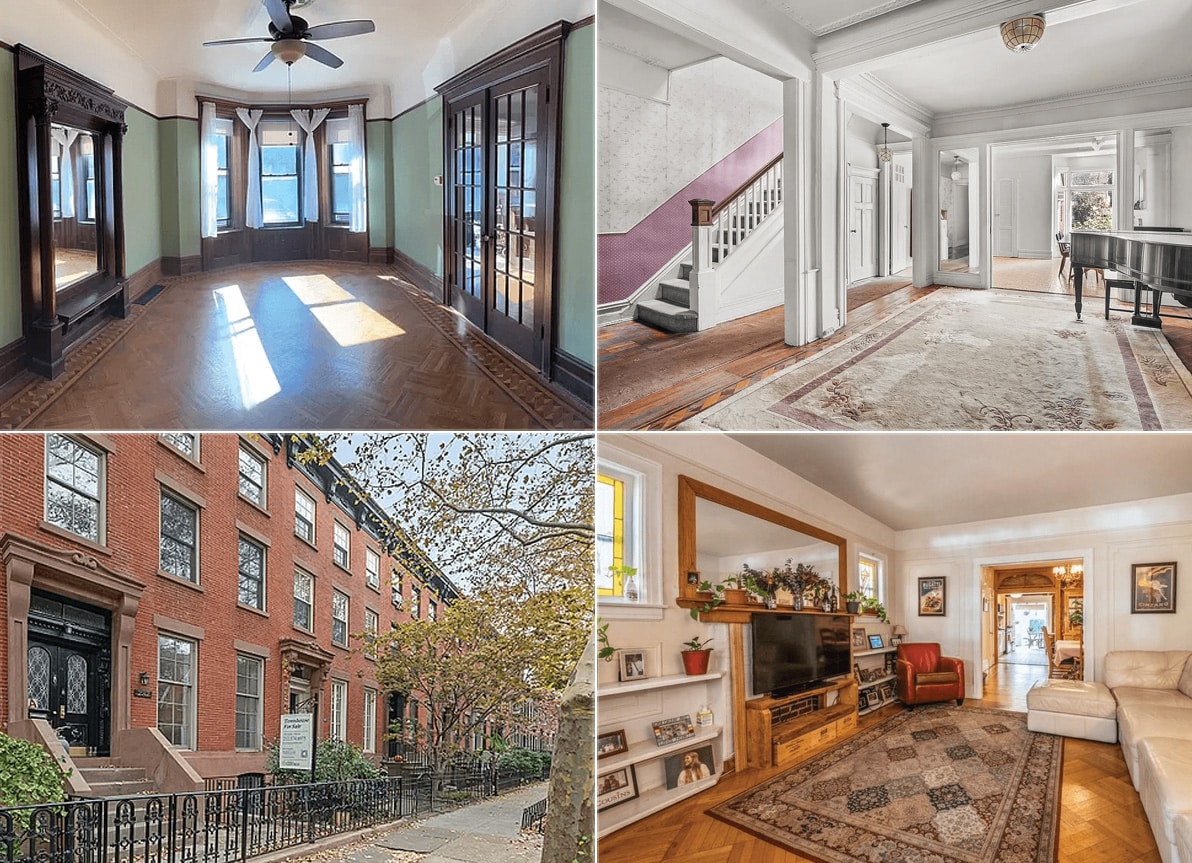
Ever since the real estate bubble burst and market indicators across the board started plummeting, everyone has wanted to know when the market was going to reach bottom. Well, maybe we’re there, nationally speaking. Dean Baker, of the Center for Economic and Policy Research, thinks so; he told AP via Fox News that “the freefall…

Ever since the real estate bubble burst and market indicators across the board started plummeting, everyone has wanted to know when the market was going to reach bottom. Well, maybe we’re there, nationally speaking. Dean Baker, of the Center for Economic and Policy Research, thinks so; he told AP via Fox News that “the freefall is over.” AP cited several nationwide statistics from the past two weeks: “home resales in June are up 9 percent from January, on a seasonally adjusted basis; sales of new homes have climbed 17 percent during the same period; and construction, while still anemic, has risen almost 20 percent since the beginning of the year.” In the Northeast, “home resales in June hit a seasonally adjusted pace of 820,000, up 28 percent from the beginning of the year. Sales of new homes were also up slightly and construction in the region more than doubled.” It is the amateur statistician, however, that reads too deeply in short-term statistics. The improvements in the market, so far, can only provide hope that the worst is behind us, but economists warn that even if this is the bottom of the barrel, we may stay down there for a while longer.
Welcome to the Bottom [Fox News]
Photo by AvarieRiot


LOL wasder!
FSRG, if your alleged respect for teachers was grounded in any sense of reality, you never would have mentioned an alleged “180 day work schedule”. By the way, if teachers live so comfortably in NYC, why do they keep leaving their profession and the city? Then you go on to make an irrelevant point about union workers’ indignation. Come to think of it, as a teacher, I have very little respect for my union, which is one of the main obstacles to educational success in this country.
Ha ha ha!
“Bottoms are long and flat.”
Try telling that to J. Lo!
You are all so ridiculous. Brooklyn Heights is not the only neighborhood in New York City. And prices are going down because that’s the cyclical nature of real estate, but that’s not going to change the fact that New York City is an expensive place to live.
“Hammered???? ROTFLMMFAO. But you’re the savvy real estate guy with all the properties.”
Yes, getting hammered on your ghetto speculative buy and getting hammered on your equities yoy. Your known track record speaks for itself. Only somebody with issues comes on here bragging about success with your track record. Such a high roller you need to sweep the stairs for your bitter renters…
sixyearsandcounting thank you for displaying the defensiveness and self righteous indignation that so permeates our civil service workforce….
I didnt say that teachers reach TOP pay in 5yrs – I said that after 10 yrs (which is when most professionals reach a good wage and when most people look to buy a house and have a family) teachers make enough to afford very nice housing in NYC (albeit not a Brownstone in the absolute prime area of Brooklyn or Manhattan)
Of course my math didnt include student loans – that is an expense that EVERYONE who financed their education is forced to endure – it has little relevance to the discussion and obviously if you havent paid off such a loan after 10yrs then obviously you’ll be able to afford LESS housing.
No one talked about teachers coming “right out of school” – of course they cant afford to buy a nice house in NYC – how many professions or careers can any significant # of people come out of school/training and right away go and buy RE?
As to the 180 days (or whatever it actually is)…..Sorry kid but teachers work less regular hours than most. In any worthwhile career especially in the ‘1st year or two’ you have to put in extra time, work weekends and occassionaly burn the midnight oil….but many teachers can eventually (and certainly by their 10th yr) use their non-school hours to supplement their incomes through – summer employment, coaching, tutoring, and the other myriad of ways offered by the system (at $42 an hr) or outside. (this is income that is generally NOT available to workers in private companies, given the set work hours all year)
If you can put today’s Chief down, and go back and look at what people wrote – no one was saying that teaching is easier or that teachers are overpayed or anything like that – it was simply an ECONOMIC discussion in which I and a few others were pointing out that it is FALSE that (many) civil servants like teachers can not afford to own a home within NYC.
Personally, I have taught a few classes to NYC kids, and I am fairly confident you couldnt pay me enough to do it as a vocation (I dont have the patience to do it) so I respect teachers immensely (even if I note how defensive and indignant many Union teachers can be) nor do I think teachers are overpaid…ALL I am saying is that Teachers (and FF and cops) are far from broke, can make a decent living and can certainly afford decent housing here in the greatest (and most expensive) city in North America.
…you had 5 whole years to enter the market before it took off. Bottoms are long and flat.
***Bid half off peak comps***
“It’s the second derivative that gets you in before the buyers who rely on the first derivative. :)”
Guys – Watching Case-Shiller YOY pass through zero is a proven method. And as you can see below, there was no rush to get in.
MONTH, READING, FROM PEAK, YOY
Sep-88 85.54 PEAK
Oct-88 85.14 -0.47%
Nov-88 84.82 -0.84%
Dec-88 84.33 -1.41%
Jan-89 84.32 -1.43%
Feb-89 83.77 -2.07%
Mar-89 83.27 -2.65%
Apr-89 82.94 -3.04%
May-89 82.97 -3.00%
Jun-89 82.95 -3.03%
Jul-89 82.67 -3.36%
Aug-89 82.63 -3.40%
Sep-89 82.38 -3.69% -3.69%
Oct-89 82.36 -3.72% -3.27%
Nov-89 81.85 -4.31% -3.50%
Dec-89 81.32 -4.93% -3.57%
Jan-90 80.89 -5.44% -4.07%
Feb-90 80.53 -5.86% -3.87%
Mar-90 79.99 -6.49% -3.94%
Apr-90 79.34 -7.25% -4.34%
May-90 79.05 -7.59% -4.72%
Jun-90 78.96 -7.69% -4.81%
Jul-90 78.78 -7.90% -4.71%
Aug-90 78.21 -8.57% -5.35%
Sep-90 77.41 -9.50% -6.03%
Oct-90 76.80 -10.22% -6.75%
Nov-90 76.14 -10.99% -6.98%
Dec-90 75.60 -11.62% -7.03%
Jan-91 74.59 -12.80% -7.79%
Feb-91 73.69 -13.85% -8.49%
Mar-91 72.87 -14.81% -8.90%
Apr-91 72.29 -15.49% -8.89% ACTUAL BOTTOM
May-91 72.63 0.47% -8.12%
Jun-91 73.50 1.67% -6.91%
Jul-91 74.39 2.90% -5.57%
Aug-91 74.90 3.61% -4.23%
Sep-91 75.06 3.83% -3.04%
Oct-91 75.01 3.76% -2.33%
Nov-91 74.84 3.53% -1.71%
Dec-91 74.74 3.39% -1.14%
Jan-92 74.59 3.18% 0.00% BOTTOM PICK (only 9 months late!)
Feb-92 74.38 2.89% 0.94%
Mar-92 74.27 2.74% 1.92%
Apr-92 74.40 2.92% 2.92%
May-92 74.69 3.32% 2.84%
Jun-92 75.14 3.94% 2.23%
Jul-92 75.47 4.40% 1.45%
Aug-92 75.79 4.84% 1.19%
Sep-92 75.74 4.77% 0.91%
Oct-92 75.48 4.41% 0.63%
Nov-92 75.38 4.27% 0.72%
Dec-92 75.35 4.23% 0.82%
Jan-93 75.54 4.50% 1.27%
Feb-93 75.42 4.33% 1.40%
Mar-93 75.32 4.19% 1.41%
Apr-93 75.34 4.22% 1.26%
May-93 75.71 4.73% 1.37%
Jun-93 76.44 5.74% 1.73%
Jul-93 76.84 6.29% 1.82%
Aug-93 76.99 6.50% 1.58%
Sep-93 76.99 6.50% 1.65%
Oct-93 76.92 6.40% 1.91%
Nov-93 76.88 6.35% 1.99%
Dec-93 76.71 6.11% 1.80%
Jan-94 76.61 5.98% 1.42%
Feb-94 76.43 5.73% 1.34%
Mar-94 76.60 5.96% 1.70%
Apr-94 76.88 6.35% 2.04%
May-94 77.55 7.28% 2.43%
Jun-94 78.20 8.18% 2.30%
Jul-94 78.78 8.98% 2.52%
Aug-94 79.08 9.39% 2.71%
Sep-94 79.08 9.39% 2.71%
Oct-94 78.87 9.10% 2.54%
Nov-94 78.50 8.59% 2.11%
Dec-94 78.36 8.40% 2.15%
Jan-95 78.28 8.29% 2.18%
Feb-95 78.29 8.30% 2.43%
Mar-95 77.95 7.83% 1.76%
Apr-95 77.77 7.58% 1.16%
May-95 78.03 7.94% 0.62%
Jun-95 78.58 8.70% 0.49%
Jul-95 78.99 9.27% 0.27%
Aug-95 79.17 9.52% 0.11%
Sep-95 79.17 9.52% 0.11%
Oct-95 79.11 9.43% 0.30%
Nov-95 78.85 9.07% 0.45%
Dec-95 78.70 8.87% 0.43%
Jan-96 78.63 8.77% 0.45%
Feb-96 78.73 8.91% 0.56%
Mar-96 78.90 9.14% 1.22%
Apr-96 78.94 9.20% 1.50%
May-96 79.36 9.78% 1.70%
Jun-96 79.52 10.00% 1.20%
Jul-96 79.97 10.62% 1.24%
Aug-96 80.31 11.09% 1.44%
Sep-96 80.45 11.29% 1.62%
Oct-96 80.35 11.15% 1.57%
Nov-96 80.02 10.69% 1.48%
Dec-96 80.03 10.71% 1.69%
Jan-97 80.08 10.78% 1.84%
Feb-97 80.08 10.78% 1.71%
Mar-97 79.97 10.62% 1.36%
Apr-97 80.03 10.71% 1.38%
May-97 80.53 11.40% 1.47%
Jun-97 81.53 12.78% 2.53%
WOW! Didn’t really pick back up until ’97! +10% is nothing! There was no rush to get in after the bottom pick or the actual bottom!
***Bid half off peak comps***
FSRG and Chaka,
I realize I’m late to reply, but:
“Cops, firefighters and NYC teachers at top pay, which comes after five years for most of those civil service titles, do make over 100K.”
Not teachers – it takes us 25 years to get to top pay. FSRG, your math assumes no student loans or any other obligations other than savings, AND that someone started teaching right out of college, which is not usually the case. And that bit about 180 days of work is a crock. First of all, during the school year at least half the weekend is taken up with work, in addition to many if not most evenings. First and second year teachers, forget having a life. If you think you can just waltz into a classroom and do a good job of it, you’re so impossibly out of touch with reality I don’t even know where to begin.